

Lactate as a marker of energy failure in critically ill patients: hypothesis
- PMID: 16356243
- PMCID: PMC1414013
- DOI: 10.1186/cc3818
Lactate as a marker of energy failure in critically ill patients: hypothesis
Abstract
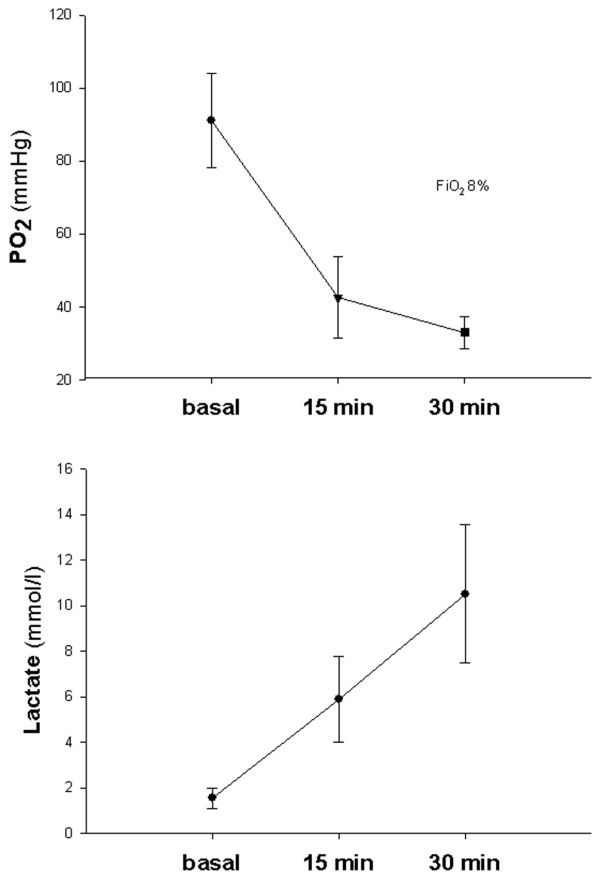
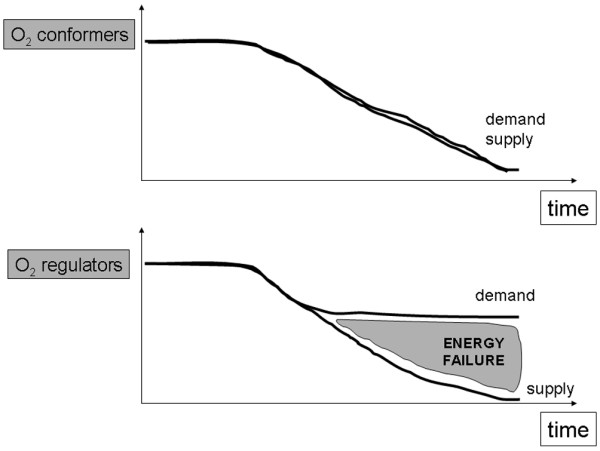
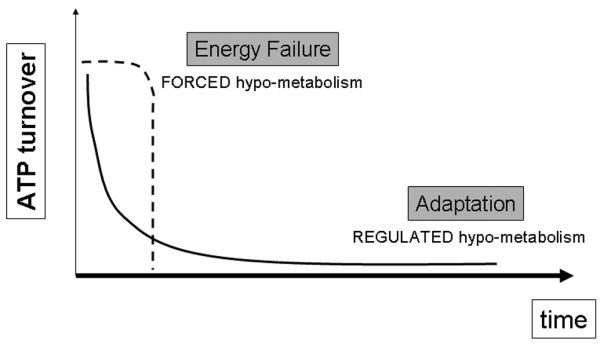
Lactate measurement in the critically ill has been traditionally used to stratify patients with poor outcome. However, plasma lactate levels are the result of a finely tuned interplay of factors that affect the balance between its production and its clearance. When the oxygen supply does not match its consumption, organisms such as man who are forced to produce ATP for their integrity adapt in many different ways up to the point when energy failure occurs. Lactate, being part of the adaptive response, may then be used to assess the severity of the supply/demand imbalance. In such a scenario, the time to intervention becomes relevant: early and effective treatment may allow the cell to revert to a normal state, as long as the oxygen machinery (i.e. mitochondria) is intact. Conversely, once the mitochondria are deranged, energy failure occurs even in the presence of normoxia. The lactate increase in critically ill patients may therefore be viewed as an early marker of a potentially reversible state.
Figures
Comment in
-
Lactate in the intensive care unit: pyromaniac, sentinel or fireman?Crit Care. 2005;9(6):622-3. doi: 10.1186/cc3935. Epub 2005 Nov 25. Crit Care. 2005. PMID: 16356247 Free PMC article.
References
-
- Mizock BA. Lactic acidosis. Dis Mon. 1989;35:233–300. - PubMed
-
- Krebs H, Wood H, Alberti K. Hyperlactatemia and lactic acidosis. Essays Med Biochem. 1975;1:81–103.
-
- Abu RS, Tannen RL. Amelioration of hypoxia-induced lactic acidosis by superimposed hypercapnea or hydrochloric acid infusion. Am J Physiol. 1986;250:F702–F709. - PubMed
Publication types
MeSH terms
Substances
LinkOut - more resources
Full Text Sources
Other Literature Sources
Medical
