

Structure and energy of a DNA dodecamer under tensile load
- PMID: 16356925
- PMCID: PMC1316112
- DOI: 10.1093/nar/gki1010
Structure and energy of a DNA dodecamer under tensile load
Abstract
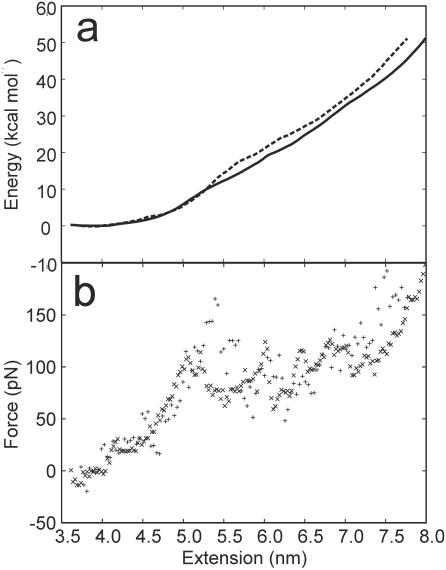
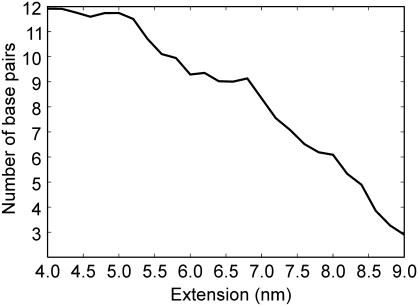
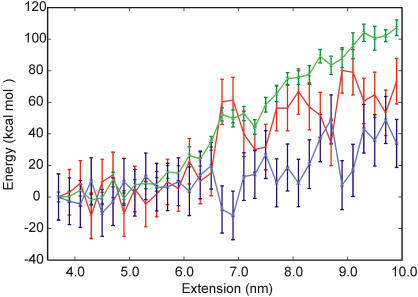
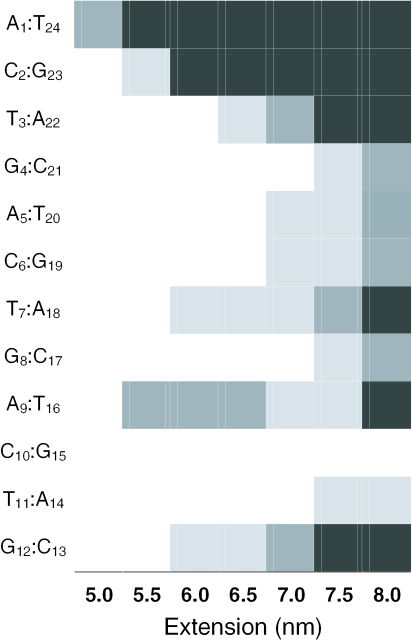
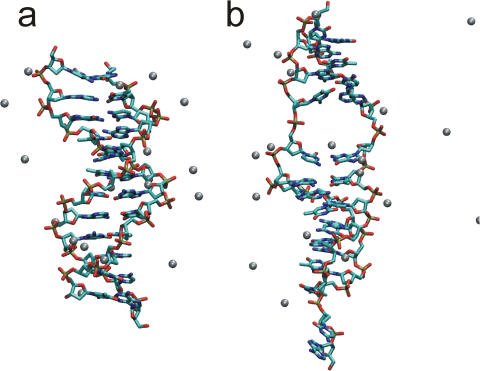
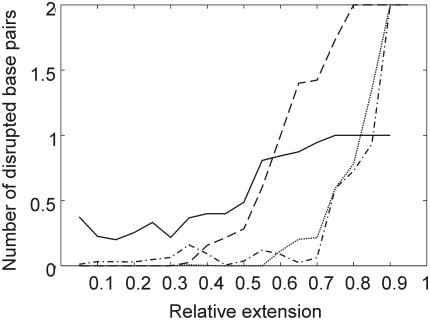
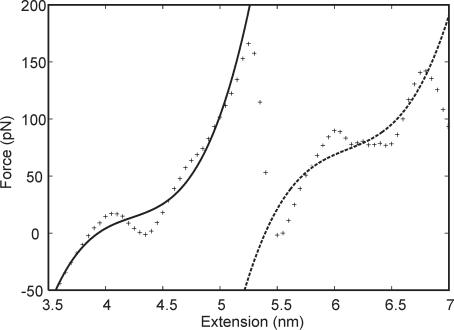
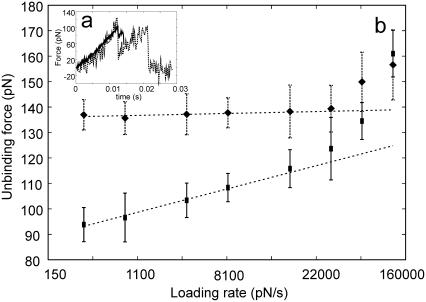
In the last decade, methods to study single DNA molecules under tensile load have been developed. These experiments measure the force required to stretch and melt the double helix and provide insights into the structural stability of DNA. However, it is not easy to directly relate the shape of the force curve to the structural changes that occur in the double helix under tensile load. Here, state-of-the-art computer simulations of short DNA sequences are preformed to provide an atomistic description of the stretching of the DNA double helix. These calculations show that for extensions larger that approximately 25% the DNA undergoes a structural transformation and a few base pairs are lost from both the terminal and central part of the helix. This locally melted DNA duplex is stable and can be extended up to approximately 50-60% of the equilibrium length at a constant force. It is concluded that melting under tension cannot be modeled as a simple two-state process. Finally, the important role of the cantilever stiffness in determining the shape of the force-extension curve and the most probable rupture force is discussed.
Figures
Similar articles
-
Molecular dynamics simulations of duplex stretching reveal the importance of entropy in determining the biomechanical properties of DNA.Biophys J. 2005 Mar;88(3):1684-91. doi: 10.1529/biophysj.104.046912. Epub 2004 Dec 30. Biophys J. 2005. PMID: 15626714 Free PMC article.
-
DNA stretching and compression: large-scale simulations of double helical structures.J Mol Biol. 1999 Jun 25;289(5):1301-26. doi: 10.1006/jmbi.1999.2798. J Mol Biol. 1999. PMID: 10373369
-
Force-induced melting of a short DNA double helix.Eur Biophys J. 2001;30(1):53-62. doi: 10.1007/s002490000107. Eur Biophys J. 2001. PMID: 11372533
-
Mechanical stability of single DNA molecules.Biophys J. 2000 Apr;78(4):1997-2007. doi: 10.1016/S0006-3495(00)76747-6. Biophys J. 2000. PMID: 10733978 Free PMC article.
-
Modelling the biomechanical properties of DNA using computer simulation.Philos Trans A Math Phys Eng Sci. 2006 Dec 15;364(1849):3319-34. doi: 10.1098/rsta.2006.1906. Philos Trans A Math Phys Eng Sci. 2006. PMID: 17090462 Review.
Cited by
-
Piezoresistivity in single DNA molecules.Nat Commun. 2015 Sep 4;6:8032. doi: 10.1038/ncomms9032. Nat Commun. 2015. PMID: 26337293 Free PMC article.
-
A three-state model with loop entropy for the overstretching transition of DNA.Biophys J. 2010 Jul 21;99(2):578-87. doi: 10.1016/j.bpj.2010.04.046. Biophys J. 2010. PMID: 20643077 Free PMC article.
-
DNA overstretching in the presence of glyoxal: structural evidence of force-induced DNA melting.Biophys J. 2008 Aug;95(3):1248-55. doi: 10.1529/biophysj.108.132688. Epub 2008 Apr 18. Biophys J. 2008. PMID: 18424499 Free PMC article.
-
Optical tweezers experiments resolve distinct modes of DNA-protein binding.Biopolymers. 2009 Apr;91(4):265-82. doi: 10.1002/bip.21123. Biopolymers. 2009. PMID: 19173290 Free PMC article. Review.
-
Force-driven separation of short double-stranded DNA.Biophys J. 2009 Dec 16;97(12):3158-67. doi: 10.1016/j.bpj.2009.09.040. Biophys J. 2009. PMID: 20006953 Free PMC article.
References
-
- Lavery R., Lebrun A., Allemand J.-F., Bensimon D., Croquette V. Structure and mechanics of single biomolecules: experiment and simulation. J. Phys. Condens. Matter. 2002;14:R383–R414.
-
- Cluzel P., Lebrun A., Heller C., Lavery R., Viovy J.-L., Chatenay D., Caron F. DNA: an extensible molecule. Science. 1996;271:792–794. - PubMed
-
- Smith S.B., Cui Y., Bustamante C. Overstretching B-DNA: the elastic response of individual double-stranded and single-stranded DNA molecules. Science. 1996;271:795–799. - PubMed
-
- Léger J.F., Romano G., Sarkar A., Robert J., Bourdieu L., Chatenay D., Marko J.F. Structural transitions of a twisted and stretched DNA molecule. Phys. Rev. Lett. 1999;83:1066–1069.
