Comparative Study
. 2006 Feb 15;571(Pt 1):165-77.
doi: 10.1113/jphysiol.2005.100735. Epub 2005 Dec 15.

Propagation of slow waves in the guinea-pig gastric antrum

Affiliations
Comparative Study

Propagation of slow waves in the guinea-pig gastric antrum

G David S Hirst et al. J Physiol. .

Abstract

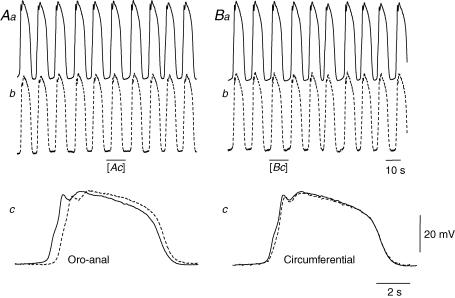
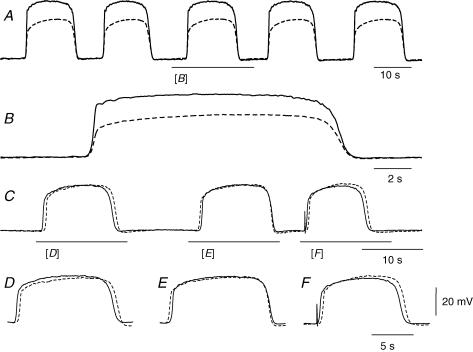
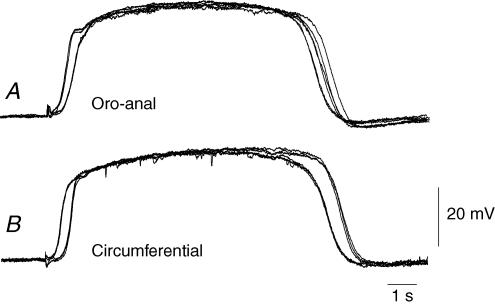
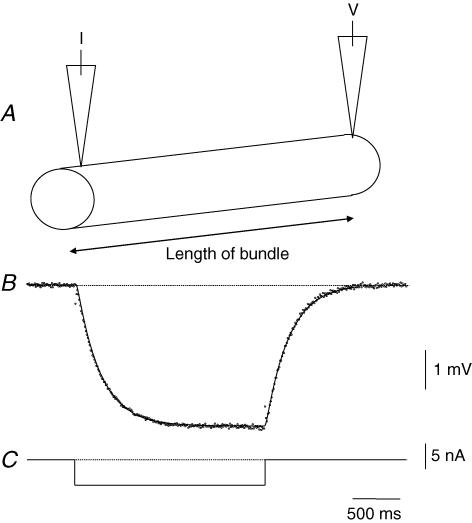
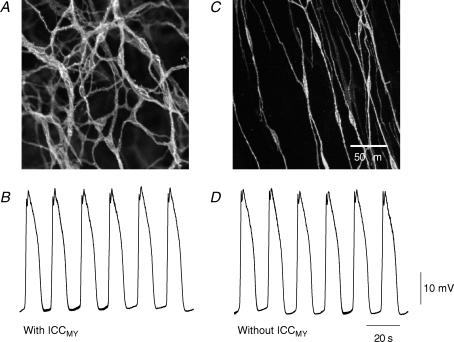
Intracellular recordings were made from the circular layer of the intact muscular wall of the guinea-pig gastric antrum in preparations where much of the corpus remained attached. When two electrodes were positioned parallel to and near to the greater curvature, slow waves were first detected at the oral site and subsequently at the anal site: the oro-anal conduction velocity was found to be 2.5 mm s(-1). When one electrode was positioned near the greater curvature and the other at a circumferential location, slow waves were first detected near the greater curvature and subsequently at the circumferential site: the circumferential conduction velocity was 13.9 mm s(-1). When recordings were made from preparations in which the circular muscle layer had been removed, the oro-anal and the circumferential conduction velocities were both about 3.5 mm s(-1). When slow waves were recorded from preparations in which much of the myenteric network of antral interstitial cells (ICC(MY)) had been dissected away, slow waves were first detected near the region of intact ICC(MY) and subsequently at a circumferential location: the circumferential conduction velocity of slow waves in regions devoid of ICC(MY) was 14.7 mm s(-1). When the electrical properties of isolated single bundles of circular muscle were determined, their length constants were about 3 mm and their time constant about 230 ms, giving an asymptotic electrotonic propagation velocity of 25 mm s(-1). Oro-anal electrical coupling between adjacent bundles of circular muscle was found to vary widely: some bundles were well connected to neighbouring bundles whereas others were not. Together the observations suggest that the slow oro-anal progression of slow waves results from a slow conduction velocity of pacemaker potentials in the myenteric network of interstitial cells. The rapid circumferential conduction of slow waves results from the electrical properties of the circular muscle layer which allow intramuscular ICC (ICC(IM)) to support the radial spread of slow waves: regions of high resistance between bundles prevent the anally directed spread of slow waves within the circular layer.


Figures

Figure 1
Figure 1. Comparison between conduction velocities of slow waves in anal and circumferential directions in the circular muscle layer of the guinea-pig gastric antrum
The upper left hand pair of traces (Aa and Ab) show simultaneous recordings of slow waves, made parallel and close to the greater curvature; the separation between electrodes was 2 mm. It can be seen that both slow waves recorded had similar amplitudes and occurred at the same frequency: the resting potential in Aa was −74 mV and in Ab was −73 mV. In the expansion of region in Ab shown by the bar, it can be seen that there was an appreciable delay between the onsets of the slow waves (Ac): from the delay and separation the conduction velocity in the anal was calculated to be 3.1 mm s−1. The upper right hand pair of traces (Ba and Bb) show simultaneous recordings of slow waves, made with one electrode close to the greater curvature and the other placed 2 mm away in a circumferential direction. Again slow waves recorded at both points had similar amplitudes and occurred at the same frequency: the resting potentials in Ba and in Bb were −74 mV. However, in the expanded region of Bb, the delay between the onsets of the slow waves (Bc) is seen to be briefer than that detected in the anal direction (Ac): from the delay and separation the conduction velocity in the circumferential direction was found to be 15.3 mm s−1. The voltage calibration bar applies to all traces. The upper time calibration bar applies to the upper pairs of traces; the lower time calibration bar applies to lower pairs of overlaid traces.
Figure 2
Figure 2. Properties of follower potentials generated in the longitudinal muscle layer by pacemaker potentials
The upper pair of superimposed traces (A) show simultaneous recordings of pacemaker potentials (continuous line) and follower potentials (dashed line) recorded from an ICCMY and a longitudinal muscle cell: the separation between electrodes was less than 20 µm. Spontaneously occurring pacemaker potentials and follower potentials occurred synchronously. In the expanded region (B), it can be seen that the onset of depolarization occurred in both cells at similar times: the resting potential of the ICCMY was −72 mV and that of the longitudinal muscle cell was −71 mV. The lower pair of superimposed traces (C) shows simultaneous recordings of follower potentials recorded 1 mm (continuous line) and 2 mm (dashed line) from the stimulating bar. In the first expansion (D), it can be seen that the spontaneously occurring follower potential was first detected at the electrode closer to the stimulating bar (continuous line). In the second expansion (E), it can be seen that the spontaneously occurring follower potential was first detected at the electrode more distant from the stimulating bar (dashed line). When the ICCMY network was stimulated (F), the ‘driven’ follower potential was first detected at the closer recording point and subsequently at the more distant recording point. The resting potentials in C were −72 mV (continuous line) and −74 mV (dashed line). The voltage calibration bar applies to all traces. The lower time calibration bar applies to traces D, E and F.
Figure 3
Figure 3. Comparison between conduction velocities of follower potentials in anal and circumferential directions in the longitudinal muscle layer of the guinea-pig gastric antrum after removal of the circular layer
The upper set of three pairs of superimposed traces (A) show simultaneous recordings of follower potentials recorded from a preparation with the longitudinal muscle layer orientated so that the evoked follower potentials conducted in an anal direction: one recording electrode was approximately 1 mm from the stimulating bar and the separation between it and the second electrode was exactly 1 mm. Follower potentials arrived at each site with a fixed latency: the arrival times were separated by 240 ms, giving an anal conduction velocity of 4.1 mm s−1. The resting membrane potential of both cells was −69 mV. The lower set of three pairs of superimposed traces (B) show simultaneous recordings of follower potentials recorded from a different preparation where the longitudinal muscle layer was orientated so that the evoked follower potentials conducted in a circumferential direction: one recording electrode was just less than 1 mm from the stimulating bar and the separation between it and the second electrode was exactly 1 mm. Again, follower potentials arrived at each site with fixed latencies: the arrival times were separated by 340 ms, giving a circumferential conduction velocity of 2.9 mm s−1. The resting membrane potential of the cell nearest the stimulating electrode was −71 mV; that of the other was −73 mV. The time and voltage calibration bars apply to all traces.
Figure 4
Figure 4. Cable properties of a single bundle of circular muscle isolated from guinea-pig antrum
The upper part of the figure illustrates schematically the experimental design (A). The bundle was impaled with two electrodes, one at each end of the bundle. One was used to inject constant current pulses and the other was used to record the resulting electrotonic potential. A pulse of current (C) evoked an electrotonic potential (B). The time course of the electrotonic potential, determined from an average of 20 successive responses, is shown as dots: the theoretical curve derived to fit the data, with length constant of 3.4 mm and time constant of 260 ms, is shown as a continuous line (B). The length of the preparation was 2.1 mm and the resting membrane potential, determined in the presence of caffeine (1 mm), was −60 mV. The time calibration bar applies to the current and voltage traces.
Figure 5
Figure 5. Electrical coupling between adjacent bundles circular muscle in the guinea-pig antrum
The upper pair of traces (Aa and Ab) shows simultaneous recordings from the same bundle of circular muscle. Note that recorded membrane potential changes were very similar. When a current pulse was passed through one electrode it produced an electronic potential with a steady state amplitude of about 11 mV (C). The lower pair of traces (Ba and Bb) shows simultaneous recordings from adjacent muscle bundles; although the regenerative potentials occurred synchronously, their shapes differed in detail. Current passed through one electrode evoked an electrotonic potential in the second bundle with a steady state amplitude of about 5 mV (C). The peak negative membrane potential of both muscle bundles, recorded in the presence of caffeine (1 mm), was −65 mV; each electrotonic potential is an average of 20 successive responses. The upper time and voltage calibration bars apply to the upper four traces. The lower time calibration bar applies to the lower voltage and current traces.
Figure 6
Figure 6. Lack of electrical coupling between adjacent bundles circular muscle in the guinea-pig antrum
The upper pair of traces (Aa and Ab) shows simultaneous recordings from the same bundle of circular muscle. When a current pulse was passed through one electrode, it produced an electronic potential with a steady state amplitude of about 10 mV (C). The lower pair of traces (Ba and Bb) shows simultaneous recordings from adjacent muscle bundles. In this example, regenerative potentials did not occur synchronously and their shapes differed. When current was passed through one electrode an electrotonic potential was not detected in the second bundle (C). The peak negative membrane potentials of the muscle bundles were −63 mV and −61 mV; each electrotonic potential is an average of 20 successive responses recorded in the presence of caffeine (1 mm). The upper time and voltage calibration bars apply to the upper four traces. The lower time calibration bar applies to the lower voltage and current traces.
Figure 7
Figure 7. Variation in coupling between bundles in the circular muscle layer of guinea-pig antrum
The upper left part of the figure schematically illustrates the experimental design (A). A preparation, consisting of 4 short adjacent circular muscle bundles was impaled with two electrodes. The electrodes were placed in one bundle, current was injected through the current-passing electrode and the electrotonic potential measured (V1). The recording electrode was successively positioned in the second and third bundles; the same current was injected into the first bundle, and V2 and V3 were determined successively. In B, three adjacent bundles were coupled together. In C, the first two bundles were coupled together but coupling between the second and third bundle could not be detected. The results from all experiments are summarized in D, where individual transfer ratios, V2/V1, were calculated from the experimental series. The column marked *, illustrates an experiment where a clearly defined anastomosis between adjacent bundles was detected visually. All recordings were made in the presence of caffeine (1 mm). The time, voltage and current calibration bars apply to all traces.
Figure 8
Figure 8. Slow waves recorded in regions of antrum with and without intact networks of ICCMY
The upper pair of micrographs shows the distribution of ICC near the greater curvature (A) and in a region of the same preparation further from the greater curvature where the longitudinal layer and ICCMY network had been dissected away (C). At the greater curvature as the microscope was focused down from the serosal surface of the preparation, ICCMY were first detected (A). In the region where the longitudinal layer had been removed, as the microscope was focused down, ICCMY were not detected but ICCIM were observed (C): the calibration scale bar in C also applies to micrograph A. The lower pairs of traces show slow waves recorded from the region where ICCMY were present (B) and from the region where ICCMY had been removed (D); the resting membrane potential of both cells was −68 mV. The time and voltage calibration bars apply to both traces.
Figure 9
Figure 9. Conduction velocity of circumferentially directed slow waves in the circular muscle layer of the guinea-pig gastric antrum in regions where ICCMY had been removed
The upper pair of traces (Aa and Ab) show simultaneous circumferential recordings of slow waves, both made from the same circular muscle bundle in a region devoid of ICCMY. The separation between electrodes was 2 mm: the recording shown as a continuous line illustrates the slow waves recorded at the point closer to the greater curvature. It can be seen that the slow waves had similar amplitudes and occurred at the same frequency: the resting potential in Aa was −69 mV and in Ab was −70 mV. In the expansion (B), it can be seen that there was a delay of about 165 ms between the rising phases of the slow wave recorded at two separate points: from the delay and electrode separation the conduction velocity was calculated to be 12.1 mm s−1. The voltage calibration bar applies to all traces. The upper time calibration bar applies to the upper pair of traces; the lower time calibration bar applies to the overlaid traces.
Figure 10
Figure 10. Propagation of slow waves in gastric antrum
The figure schematically illustrates the functional organization of the antrum which would allow coordinated circumferential rings of contraction to slowly migrate down the stomach. Pacemaker potentials, first initiated at the interface between the corpus and the antrum, slowly conduct in an oro-anal direction through the ICCMY network. Each pacemaker potential depolarizes successive circular muscle bundles. The depolarization activates ICCIM and, because of the rapid electronic conduction velocity of the circular layer, slow waves readily propagate circumferentially. Regions of electrical continuity between muscle bundles are illustrated as closed rectangles. The occasional absence of such a connection means that the layer is made of several muscle units and oro-anal conduction of slow waves in the circular layer does not occur.

Comment in

References

    1. Beckett EA, Bayguinov YR, Sanders KM, Ward SM, Hirst GDS. Properties of unitary potentials generated by intramuscular interstitial cells of Cajal in the murine and guinea-pig gastric fundus. J Physiol. 2004;559:259–269. - PMC - PubMed
    1. Burns AJ, Herbert TM, Ward SM, Sanders KM. Interstitial cells of Cajal in the guinea-pig gastrointestinal tract as revealed by c-Kit. Cell Tissue Res. 1997;290:11–20. - PubMed
    1. Cousins HM, Edwards FR, Hickey H, Hill CE, Hirst GDS. Electrical coupling between the myenteric interstitial cells of Cajal and adjacent muscle layers in the guinea-pig gastric antrum. J Physiol. 2003;550:829–844. - PMC - PubMed
    1. Cousins HM, Edwards FR, Hirst GDS, Wendt IR. Cholinergic neuromuscular transmission in the longitudinal muscle of the guinea-pig ileum. J Physiol. 1993;471:61–86. - PMC - PubMed
    1. Dickens EJ, Edwards FR, Hirst GDS. Selective knockout of intramuscular interstitial cells reveals their role in the generation of slow waves in mouse stomach. J Physiol. 2001;531:827–833. - PMC - PubMed

Publication types

MeSH terms

Substances

LinkOut - more resources