Apoptotic cells initiate endothelial cell sprouting via electrostatic signaling
- PMID: 16357162
- PMCID: PMC1404497
- DOI: 10.1158/0008-5472.CAN-05-2718
Apoptotic cells initiate endothelial cell sprouting via electrostatic signaling
Abstract
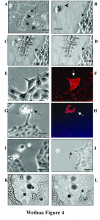
Angiogenesis, the development of new blood vessels from preexisting vessels, is crucial to tissue growth, repair, and maintenance. This process begins with the formation of endothelial cell sprouts followed by the proliferation and migration of neighboring endothelial cells along the preformed extensions. The initiating event and mechanism of sprouting is not known. We show that the phenotypic expression of negatively charged membrane surface in apoptotic cells initiates the formation of directional endothelial cell sprouts that extend toward the dying cells by a mechanism that involves endothelial cell membrane hyperpolarization and cytoskeleton reorganization but is independent of diffusible molecules.
Figures


Similar articles
-
Guided migration as a novel mechanism of capillary network remodeling is regulated by basic fibroblast growth factor.Histochem Cell Biol. 1998 Apr;109(4):319-29. doi: 10.1007/s004180050232. Histochem Cell Biol. 1998. PMID: 9562381
-
Synaptojanin-2 binding protein stabilizes the Notch ligands DLL1 and DLL4 and inhibits sprouting angiogenesis.Circ Res. 2013 Nov 8;113(11):1206-18. doi: 10.1161/CIRCRESAHA.113.301686. Epub 2013 Sep 11. Circ Res. 2013. PMID: 24025447
-
Blood vessel maturation in a 3-dimensional spheroidal coculture model: direct contact with smooth muscle cells regulates endothelial cell quiescence and abrogates VEGF responsiveness.FASEB J. 2001 Feb;15(2):447-57. doi: 10.1096/fj.00-0139com. FASEB J. 2001. PMID: 11156960
-
Vimentin as an integral regulator of cell adhesion and endothelial sprouting.Microcirculation. 2014 May;21(4):333-44. doi: 10.1111/micc.12111. Microcirculation. 2014. PMID: 24387004 Review.
-
Molecular mechanisms that control endothelial cell contacts.J Pathol. 2000 Feb;190(3):281-91. doi: 10.1002/(SICI)1096-9896(200002)190:3<281::AID-PATH527>3.0.CO;2-Z. J Pathol. 2000. PMID: 10685062 Review.
Cited by
-
Brain endothelial cell death: modes, signaling pathways, and relevance to neural development, homeostasis, and disease.Mol Neurobiol. 2010 Aug;42(1):52-63. doi: 10.1007/s12035-010-8132-6. Epub 2010 Apr 21. Mol Neurobiol. 2010. PMID: 20407845 Review.
-
Identification of ARIA regulating endothelial apoptosis and angiogenesis by modulating proteasomal degradation of cIAP-1 and cIAP-2.Proc Natl Acad Sci U S A. 2009 May 19;106(20):8227-32. doi: 10.1073/pnas.0806780106. Epub 2009 May 1. Proc Natl Acad Sci U S A. 2009. PMID: 19416853 Free PMC article.
-
A ligand-insensitive UNC5B splicing isoform regulates angiogenesis by promoting apoptosis.Nat Commun. 2021 Aug 11;12(1):4872. doi: 10.1038/s41467-021-24998-6. Nat Commun. 2021. PMID: 34381052 Free PMC article.
-
Bio-orthogonal phosphatidylserine conjugates for delivery and imaging applications.J Org Chem. 2008 Aug 15;73(16):6053-8. doi: 10.1021/jo8011336. Epub 2008 Jul 11. J Org Chem. 2008. PMID: 18616222 Free PMC article.
-
Genome-wide analysis reveals conserved transcriptional responses downstream of resting potential change in Xenopus embryos, axolotl regeneration, and human mesenchymal cell differentiation.Regeneration (Oxf). 2015 Nov 26;3(1):3-25. doi: 10.1002/reg2.48. eCollection 2016 Feb. Regeneration (Oxf). 2015. PMID: 27499876 Free PMC article.
References
-
- Risau W. Mechanisms of angiogenesis. Nature. 1997;386:671–4. - PubMed
-
- Carmeliet P, Jain RK. Angiogenesis in cancer and other diseases. Nature. 2000;407:249–57. - PubMed
-
- Hanahan D, Folkman J. Patterns and emerging mechanisms of the angiogenic switch during tumourigenesis. Cell. 1996;86:353–64. - PubMed
-
- Folkman J. Fundamental concepts of the angiogenic process. Curr Mol Med. 2003;3:643–51. - PubMed
-
- Grote J, Susskind R, Vaupel P. Oxygen diffusivity in tumour tissue (DS-carcinosarcoma) under temperature conditions within the range of 20-40°C. Pflugers Arch. 1977;372:37–42. - PubMed
Publication types
MeSH terms
Substances
Grants and funding
LinkOut - more resources
Full Text Sources
Other Literature Sources

