. 2005 Dec 27;102(52):19103-8.
doi: 10.1073/pnas.0505231102. Epub 2005 Dec 15.

The global transcriptional regulatory network for metabolism in Escherichia coli exhibits few dominant functional states

Affiliations

The global transcriptional regulatory network for metabolism in Escherichia coli exhibits few dominant functional states

Christian L Barrett et al. Proc Natl Acad Sci U S A. .

Abstract

A principal aim of systems biology is to develop in silico models of whole cells or cellular processes that explain and predict observable cellular phenotypes. Here, we use a model of a genome-scale reconstruction of the integrated metabolic and transcriptional regulatory networks for Escherichia coli, composed of 1,010 gene products, to assess the properties of all functional states computed in 15,580 different growth environments. The set of all functional states of the integrated network exhibits a discernable structure that can be visualized in 3-dimensional space, showing that the transcriptional regulatory network governing metabolism in E. coli responds primarily to the available electron acceptor and the presence of glucose as the carbon source. This result is consistent with recently published experimental data. The observation that a complex network composed of 1,010 genes is organized to achieve few dominant modes demonstrates the utility of the systems approach for consolidating large amounts of genome-scale molecular information about a genome and its regulation to elucidate an organism's preferred environments and functional capabilities.


Figures

Fig. 1.
Fig. 1.
A graphical depiction of how growth simulations are encoded into computation-based activity profiles (Left) and how gene expression measurements are combined with the known structure of the transcriptional regulatory network to create expression-based activity profiles (Right). (A) The example network contains genes for two transcription factors and an enzyme. (B) The gene 0/1 (off/on) states in each time step tn of a simulation and the log-transformed signal-intensity values from microarray experiment for a defined growth environment. (C) How a “basic unit” is defined for both simulated and experimental data, one of which exists for every TF-regulated (target) gene pair in the E. coli reconstruction. For simulation, each cell of the basic unit gets either a “0” or a “1,” depending on whether its associated TF and target gene were observed to be in the indicated off/on combination in any simulation time step. For experiment, the logical interaction between the TF and target gene is encoded as the logarithm of the ratio of their signal-intensity values. (D) The basic units for the example in A are shown. Concatenating the basic units forms the final activity profile.
Fig. 2.
Fig. 2.
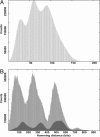
The distribution of pair-wise Hamming distances between simulated gene-expression (A) and network (B) activity profiles of the 15,580 growth simulations using iMC1010v1.
Fig. 3.
Fig. 3.
The clusters of all computation-based gene-expression profiles of iMC1010v1 projected into 3-dimensional space. The numbers in parentheses by each cluster in the key are the numbers of different profiles in the cluster. The clusters whose contained profiles all correspond to growth environments with the same terminal electron acceptor are listed (Upper Right). The units of each axis are in bits, as given by the Hamming distance computed between computation-based expression profiles that are contained within the clusters.
Fig. 4.
Fig. 4.
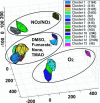
The clusters of all computation-based activity profiles of iMC1010v1 projected into 3-dimensional space, allowing visualization of the “space” of transcriptional regulation and metabolic functional capabilities. The numbers in parentheses by each cluster in the key are the numbers of different activity profiles in the cluster. Comparison of the clusters shows that they can be distinguished by the available electron acceptor (indicated by the ellipses) and the carbon source and, to a lesser degree, by the nitrogen source. The units of each axis are in bits, as given by the Hamming distance computed between computation-based activity profiles contained within the clusters.

References

    1. Selinger, D. W., Wright, M. A. & Church, G. M. (2003) Trends Biotechnol. 21, 251-254. - PubMed
    1. Ideker, T., Galitski, T. & Hood, L. (2001) Annu. Rev. Genom. Hum. Genet. 2, 343-372. - PubMed
    1. Kitano, H. (2002) Science 295, 1662-1664. - PubMed
    1. Kitano, H. (2002) Nature 420, 206-210. - PubMed
    1. Oltvai, Z. N. & Barabasi, A. L. (2002) Science 298, 763-764. - PubMed

Publication types