. 2005 Dec 15;19(24):2941-6.
doi: 10.1101/gad.1352305.

Polycomb mediates Myc autorepression and its transcriptional control of many loci in Drosophila

Affiliations

Polycomb mediates Myc autorepression and its transcriptional control of many loci in Drosophila

Julie M Goodliffe et al. Genes Dev. .

Abstract

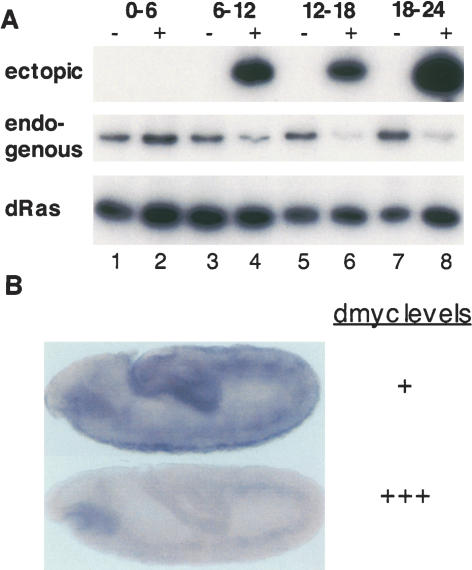
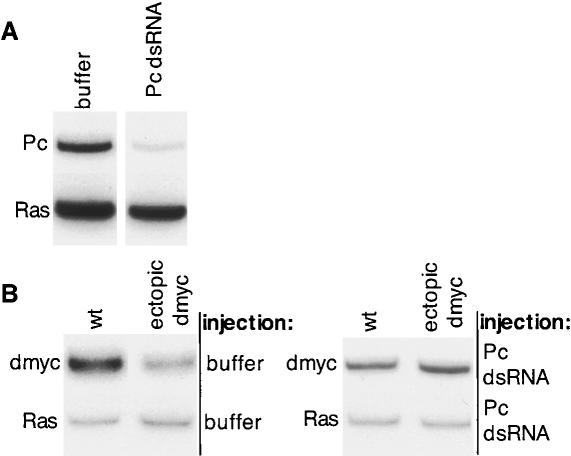
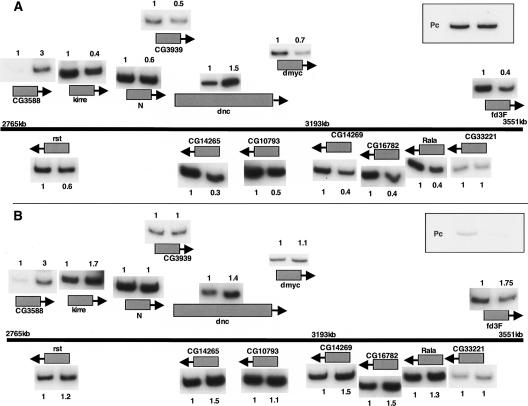
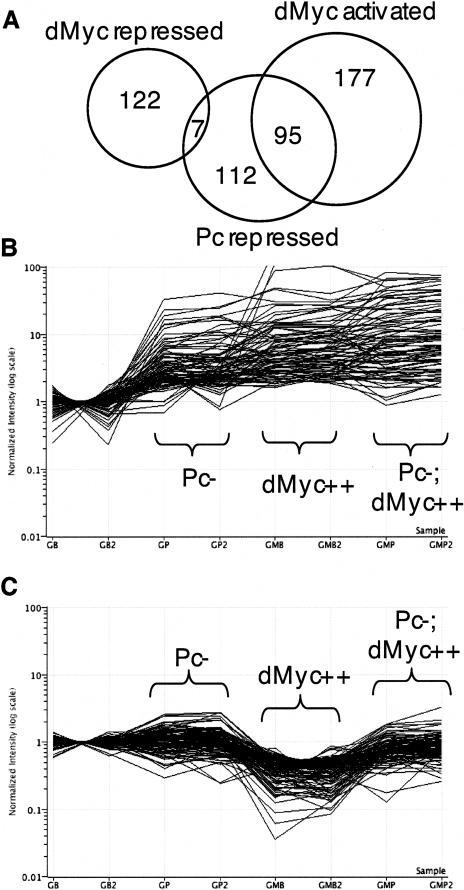
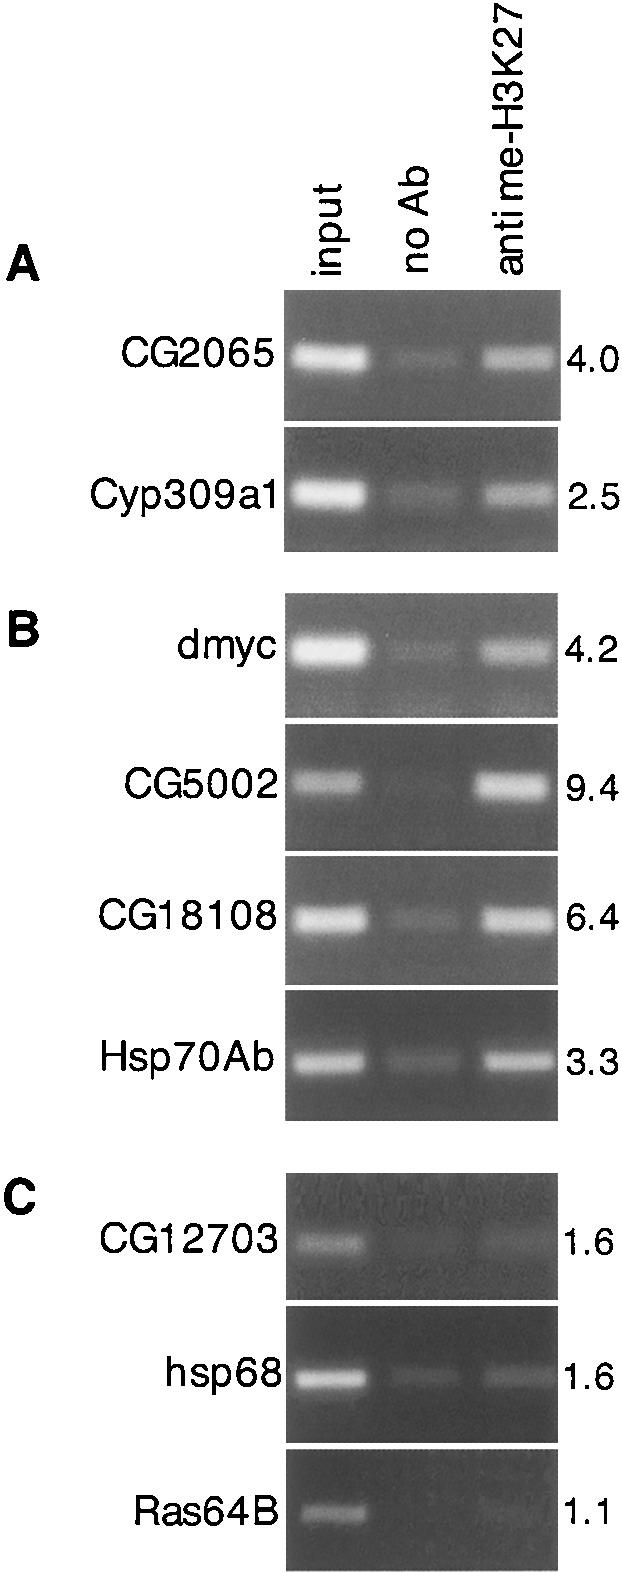
Aberrant accumulation of the Myc oncoprotein propels proliferation and induces carcinogenesis. In normal cells, however, an abundance of Myc protein represses transcription at the c-myc locus. Cancer cells often lose this autorepression. We examined the control of myc in Drosophila and show here that the Drosophila ortholog, dmyc, also undergoes autorepression. We find that the developmental repressor Polycomb (Pc) is required for dmyc autorepression, and that this Pc-dMyc-mediated repression spreads across an 875-kb region encompassing the dmyc gene. To further investigate the relationship between Myc and Polycomb, we used microarrays to identify genes regulated by each, and identify a striking relationship between the two: A large set of dMyc activation targets is normally repressed by Pc, and 73% of dMyc repression targets require Pc for this repression. Chromatin immunoprecipitation confirmed that many dMyc-Pc-repressed loci have an epigenetic mark recognized by Pc. Our results suggest a novel relationship between Myc and Polycomb, wherein Myc enhances Polycomb repression in order to repress targets, and Myc suppresses Polycomb repression in order to activate targets.


Figures

Figure 1.
Figure 1.
Ectopic dMyc induces autorepression of dmyc. (A) Endogenous dmyc is repressed upon ectopic dmyc expression. RT-PCR amplification products are shown of RNA from wild-type (lanes 1,3,5,7) or ectopic dmyc (lanes 2,4,6,8) embryos at 0-6 h (lanes 1,2), 6-12 h (lanes 3,4), 12-18 h (lanes 5,6), and 18-24 h (lanes 7,8) after egg laying, at 18°C. (Top) Ectopic dmyc was amplified using a forward primer specific for an epitope tag present in the transgene. (Middle) Endogenous dmyc was amplified using a forward primer specific for the dmyc 5′-UTR. (Bottom) dRas64B was amplified with dRas64B-specific oligonucleotides as a control for RNA levels. (B) Autorepression in situ: stage 10 embryos stained with a riboprobe specific for the dmyc 5′-UTR in wild-type (top) and ectopic dmyc (bottom) embryos. The region complementary to the probe is not included in the UAS dmyc transgene.
Figure 2.
Figure 2.
Pc is required for dmyc autorepression. (A) Pc depletion in Pc RNAi embryos, as shown by RT-PCR amplification of Pc (top) and dRas64B (bottom), in embryos injected with buffer (bands on left) and Pc dsRNA (bands on right). These embryos all have ectopic dmyc. (B) Pc RNAi eliminates dmyc autorepression, shown by RT-PCR amplification of endogenous dmyc in wild-type embryos (bands on the left for each panel) or ectopic dmyc embryos (bands on the right for each panel), injected with buffer (left panel) or Pc dsRNA (right panel). Ras64B is shown as a control for RNA levels (lower bands in both panels).
Figure 3.
Figure 3.
dMyc-mediated repression of dmyc affects cytological region 3C3-3F2. (A) Buffer-injected embryos of either wild type (all bands on the left) or ectopic dmyc (all bands on the right) provided RNA to amplify the following genes in the region of 3C3-3F2, distal to proximal: CG3588, rst, kirre, N, CG3939, dnc, CG14265, CG10793, dmyc, CG14269, CG16782, Rala, CG33221, and fd3F. (Upper right) Pc transcripts are shown by RT-PCR in the box. The X chromosome is depicted by the thick black line. The numbers above or below each band are the relative band intensities between pairs, normalized to the control reaction (dRas64B). The sequence location of the region along the X chromosome for Release 4 is indicated in kilobases. (B) Repression of 3C3-3F2 by dmyc is mediated by Pc. Pc RNAi embryos of either wild type (all bands on the left) or expressing ectopic dmyc (all bands on the right) provided a template to amplify the genes shown in A. (Upper right) Pc transcripts are shown in the box. The numbers above or below each band are the relative band intensities between pairs, normalized to the control, Ras64B, reaction.
Figure 4.
Figure 4.
Microarray data illustrate that a subset of dMyc activation targets is normally repressed by Pc, and a majority of dMyc repression targets require Pc for repression. (A) A Venn diagram shows that dMyc-repressed genes and Pc-repressed genes overlap by a very small number of genes, within the realm of random chance (P = 0.08). In contrast, dMyc-activated genes and Pc-repressed genes overlap by a highly significant amount (P = 10-83). (B,C) Each line illustrates the log10 of normalized intensity of one gene for eight different chip hybridizations: Gal4, buffer injected (GB) and repeat (GB2); Gal4, Pc RNAi (GP) and repeat (GP2); Gal4, UAS dmyc, buffer injected (GMB) and repeat (GMB2); Gal4, UAS dmyc, Pc RNAi (GMP) and repeat (GMP). Each gene in B is dMyc-activated and also Pc-repressed (95 genes), and each gene shown in C is dMyc-repressed (129 genes).
Figure 5.
Figure 5.
Pc- and dMyc-repressed genes are trimethylated at histone H3 Lys 27. (A-C) Amplified genomic DNA pulled down by ChIP for each of two Pc-repressed (A), four dMyc-repressed (B), and three unaffected (C) genes is shown. Input DNA from sonicated chromatin is shown on the left, ChIP with no antibody is shown in the middle, and ChIP with anti-trimethyl H3K27 is shown on the right. The genotype of the embryos used in this experiment was arm-Gal4. The numbers on the right show the fold changes in band intensities from the second to third lines.

References

    1. Cao R., Wang, L., Wang, H., Xia, L., Erdjument-Bromage, H., Tempst, P., Jones, R.S., and Zhang, Y. 2002. Role of histone H3 lysine 27 methylation in Polycomb-group silencing. Science 298: 1039-1043. - PubMed
    1. Cole M.D. 1986. The myc oncogene: Its role in transformation and differentiation. Annu. Rev. Genet. 20: 361-384. - PubMed
    1. Czermin B., Melfi, R., McCabe, D., Seitz, V., Imhof, A., and Pirrotta, V. 2002. Drosophila enhancer of Zeste/ESC complexes have a histone H3 methyltransferase activity that marks chromosomal Polycomb sites. Cell 111: 185-196. - PubMed
    1. Fischle W., Wang, Y., Jacobs, S.A., Kim, Y., Allis, C.D., and Khorasanizadeh, S. 2003. Molecular basis for the discrimination of repressive methyl-lysine marks in histone H3 by Polycomb and HP1 chromodomains. Genes & Dev. 17: 1870-1881. - PMC - PubMed
    1. Francis N.J., Kingston, R.E., and Woodcock, C.L. 2004. Chromatin compaction by a polycomb group protein complex. Science 306: 1574-1577. - PubMed

Publication types

MeSH terms

LinkOut - more resources