. 2005 Dec 15;19(24):3017-30.
doi: 10.1101/gad.1373005.

The core centromere and Sgo1 establish a 50-kb cohesin-protected domain around centromeres during meiosis I

Affiliations

The core centromere and Sgo1 establish a 50-kb cohesin-protected domain around centromeres during meiosis I

Brendan M Kiburz et al. Genes Dev. .

Abstract

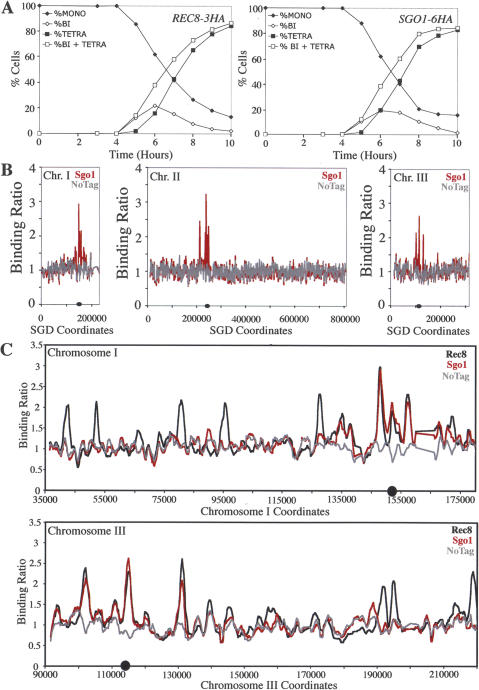
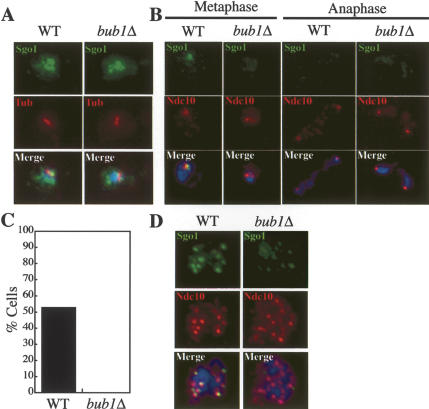
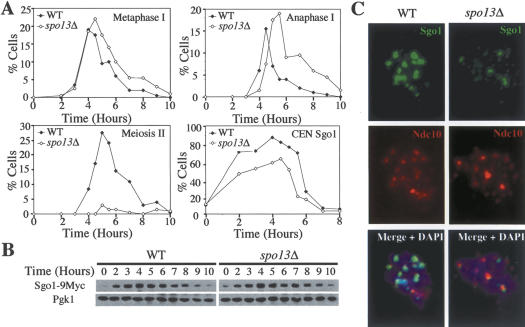
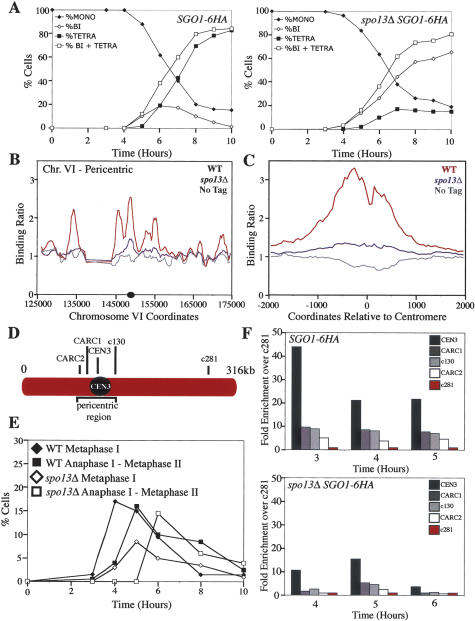
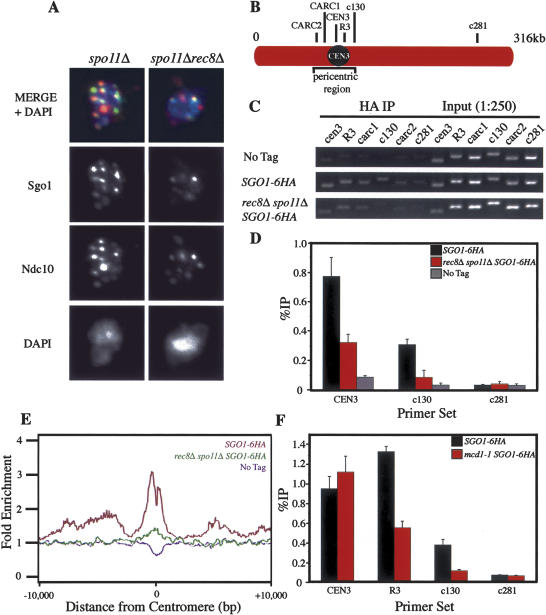
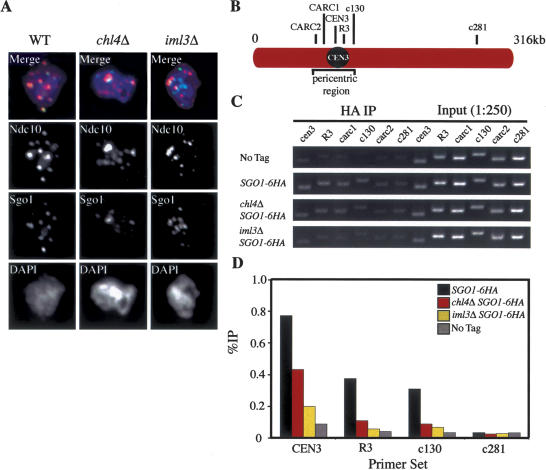
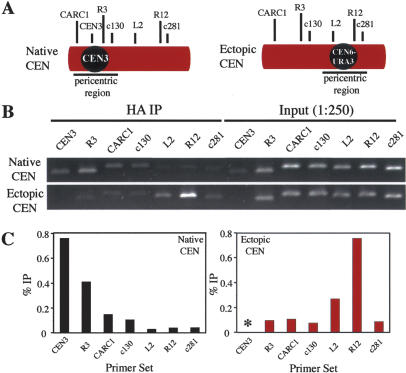
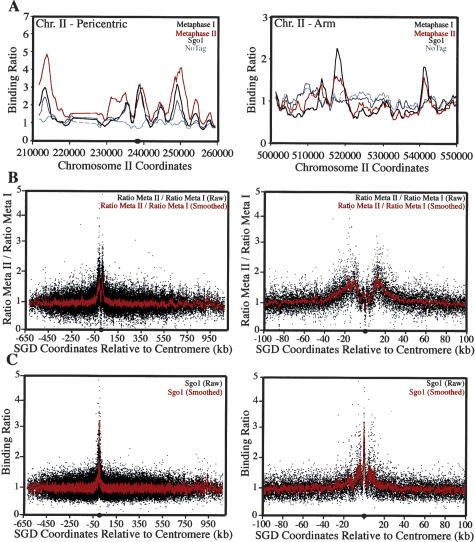
The stepwise loss of cohesins, the complexes that hold sister chromatids together, is required for faithful meiotic chromosome segregation. Cohesins are removed from chromosome arms during meiosis I but are maintained around centromeres until meiosis II. Here we show that Sgo1, a protein required for protecting centromeric cohesins from removal during meiosis I, localizes to cohesin-associated regions (CARs) at the centromere and the 50-kb region surrounding it. Establishment of this Sgo1-binding domain requires the 120-base-pair (bp) core centromere, the kinetochore component Bub1, and the meiosis-specific factor Spo13. Interestingly, cohesins and the kinetochore proteins Iml3 and Chl4 are necessary for Sgo1 to associate with pericentric regions but less so for Sgo1 to associate with the core centromeric regions. Finally, we show that the 50-kb Sgo1-binding domain is the chromosomal region where cohesins are protected from removal during meiosis I. Our results identify the portions of chromosomes where cohesins are protected from removal during meiosis I and show that kinetochore components and cohesins themselves are required to establish this cohesin protective domain.


Figures

Figure 1.
Figure 1.
Sgo1 localizes to centromeric and pericentric cohesin-associated regions. (A) Wild-type diploid strains carrying REC8-3HA (A4758) and SGO1-6HA (A12282) fusions as well as a strain lacking them (A4962) were sporulated (see Materials and Methods). The percentage of mononucleated (closed diamonds), binucleated (open diamonds), and tetranucleated (closed squares), as well as the sum of binucleated and tetranucleated (open squares) was determined at the indicated time points for strains A4758 and A12282. Two-hundred cells were counted per time point. The data shown represent the average of two different cultures used for the genome-wide location analysis shown in B and C. (B) The binding ratios of immunoprecipitated Sgo1-6HA for chromosomes I, II, and III are shown. Values for a strain carrying the SGO1-6HA allele are shown in red, and those for a strain lacking tagged Sgo1 are shown in gray. The X-axis shows SGD coordinates for each chromosome. (C) Binding ratios for the REC8-3HA strain (black), the SGO1-6HA strain (red), and an untagged strain (No Tag, gray) around the centromere and arms of chromosomes I and III are shown. Shown in particular are the regions where the transition occurs from Sgo1 and Rec8 binding overlapping to a region where this is no longer the case. The gap to the right of the centromere of chromosome I represents a Ty element.
Figure 2.
Figure 2.
BUB1 is required for Sgo1 localization during both mitosis and meiosis. (AC) Exponentially growing wild-type cells (A11738) and cells deleted for BUB1 (A12634) carrying SGO1-9MYC and NDC10-6HA fusions were harvested to determine the localization of Sgo1-9Myc and Ndc10-6HA by whole-cell immunofluorescence (A) and on spread nuclei (B). Sgo1 is shown in green, tubulin (Tub) in red, Ndc10 in red, and DNA stained by DAPI (4′,6-diamidino-2-phenolindole) in blue. (C) The percentage of mononucleated cells from the experiment in B in which an Sgo1 signal colocalized with an Ndc10 signal. One-hundred mononucleated cells were counted for each strain. (D) Wild-type (A13179) and bub1Δ (A13177) cells carrying an SGO1-9MYC and NDC10-6HA fusion were induced to sporulate. After 6 h, samples were taken to determine the localization of Sgo1 (green) and Ndc10 (red) on spread nuclei. DNA stained by DAPI is shown in blue.
Figure 3.
Figure 3.
SPO13 is required for full association of Sgo1 with chromosomes. (A–C) Wild-type (A10461, closed diamonds) and spo13Δ (A10755, open diamonds) cells carrying an SGO1-9MYC and NDC10-6HA fusion were induced to sporulate. The percentage of cells with metaphase I spindles (A, Metaphase I), anaphase I spindles (A, Anaphase I), and meiosis II spindles (A, Meiosis II); the percentage of cells with Sgo1 associated with centromeric regions (A, CEN Sgo1); and the amount of Sgo1 protein (B) were determined at the indicated time points. Pgk1 was used as a loading control in Western blots. (C) An example of Sgo1 localization on nuclear spreads of wild-type and spo13Δ cells. Sgo1 is shown in green, Ndc10 in red, and DNA in blue.
Figure 4.
Figure 4.
SPO13 maintains Sgo1 association with chromosomes. (AC) Wild-type (A12282; WT) and spo13Δ (A11967; spo13Δ) cells carrying an SGO1-6HA fusion, as well as a strain lacking the fusion (A4962; No Tag) were sporulated. (A) The percentage of mononucleated (closed diamonds), binucleated (open diamonds), and tetranucleated (closed squares), as well as the sum of binucleated and tetranucleated (open squares) was determined at the indicated time points for strains A12282 and A11967. The data shown represent the average of two different cultures used for the genome-wide location analysis experiments. (B) The binding ratios for Sgo1-6HA within a 50-kb region surrounding the centromere of chromosome VI 5 h after transfer into sporulation medium. (C) The binding ratios for Sgo1-6HA averaged across all 16 centromeres. The X-axis shows SGD coordinates relative to the centromere for each chromosome, taking into account centromere orientation. (D) Primer sets corresponding to CARs adjacent to the centromere of chromosome III (CEN3, CARC1, c130, CARC2) and a negative control region on the arm of chromosome III (c281). (E,F) Samples were taken for ChIP from wild-type (WT; A12282) and spo13Δ (A11967) cells. (E) Progression through meiosis as the percentage of wild-type metaphase I (closed diamonds), wild-type anaphase I–metaphase II (closed squares), spo13Δ metaphase I (open diamonds), and spo13Δ anaphase I–metaphase II (open squares) spindles. (F) The fold enrichment for sequences relative to a negative control sequence (c281) at the indicated time points as determined by semiquantitative PCR. Note that the strain deleted for SPO13 is delayed 1 h in entering meiosis.
Figure 5.
Figure 5.
The Sgo1 distribution is altered in rec8Δ and mcd1-1 cells. (A) spo11Δ (A10593) and rec8Δ spo11Δ (A11233) diploid strains carrying SGO1-9MYC and NDC10-6HA fusions were sporulated to examine Sgo1 localization by chromosome spreads. Sgo1 is shown in green, Ndc10 in red, and DNA in blue. (BD) Wild-type (A12282) and spo11Δ rec8Δ (A13726) cells carrying the SGO1-6HA fusion were sporulated along with a strain lacking the tagged protein (A4962). (B) The location of primers used for PCR analysis. c281 is used as a negative control sequence. Primer set R3 amplifies a region ∼800 bp to the right of the core centromere. (C) PCR analysis of ChIP samples harvested 5 h after transfer into sporulation medium. (D) The percent immunoprecipitation (%IP) calculated as the percent of immunoprecipitated DNA signal returned in IP fractions. Immunoprecipitations were performed in triplicate from a single cell lysate. Error bars indicate the standard error of the mean. (E) The binding ratios for Sgo1-6HA averaged across all 16 centromeres in wild-type (A12282; red), spo11Δ rec8Δ (A13726; green), and a strain lacking the fusion (A4962; No Tag, blue) 5 h after transfer into sporulation medium. (F) Wild-type (A10652) and mcd1-1 (A13773) cells carrying the SGO1-6HA tag were arrested in G1 by addition of α-factor pheromone. Cells were released into fresh growth medium at 37°C in the presence of nocodazole. Samples were taken for ChIP after 2 h. Shown is the percent immunoprecipitation (%IP) calculated as the percent of immunoprecipitated DNA signal returned in IP fractions. Immunoprecipitations were performed in triplicate from a single cell lysate. Error bars indicate the standard error of the mean.
Figure 6.
Figure 6.
IML3 and CHL4 are required for Sgo1 to associate with pericentric CARs. (A) Wild-type (A10461), chl4Δ (A10629), and iml3Δ (A10628) diploid strains carrying SGO1-9MYC and NDC10-6HA fusions were sporulated to examine Sgo1 localization by chromosome spreads. Sgo1 is shown in green, Ndc10 in red, and DNA in blue. (BD) Wild-type (A12282), chl4Δ (A13970), and iml3Δ (A13971) cells carrying the SGO1-6HA fusion were sporulated along with a strain lacking the tagged protein (A4962). (B) The location of primers used for ChIP analysis. c281 is used as a negative control sequence. Primer set R3 amplifies a region ∼800 bp to the right of the core centromere. (C) PCR analysis of ChIP samples harvested 4 h (A4962, A12282) or 5 h (A13970, A13971) after transfer into sporulation medium such that cells would be enriched for a population just prior to metaphase. Note that chl4Δ and iml3Δ cells are delayed 1 h in entering meiosis. (D) The percent immunoprecipitation (%IP) calculated as the percent of immunoprecipitated DNA signal returned in IP fractions. Each experiment was performed at least twice, and the average percent immunoprecipitation is shown.
Figure 7.
Figure 7.
The 120-bp core centromere is sufficient to establish an Sgo1-binding domain around itself. A wild-type strain (A10652) and a strain carrying an ectopic centromere on the arm of chromosome III (A13806) and each carrying an SGO1-6HA fusion were arrested in G1 with α-factor pheromone. Cells were released into medium lacking the pheromone but containing the microtubule depolymerizing drug nocodazole (15 μg/mL). Samples were taken for ChIP 2 h after release. (A) Primer sets corresponding to CARs along chromosome III including adjacent to the native centromere (CEN3, R3, CARC1, c130), ectopic centromere (L2, R12), and a negative control region (c281). L2 is ∼2 kb away from CEN6-URA3 and R12 is ∼12 kb to the right. c281 is ∼20 kb to the right of the ectopic centromere. PCR reactions were performed using the immunoprecipitated DNA as well as input DNA for the wild-type strain and the ectopic centromere strain in B, and are quantified in C. An asterisk is shown in the place of CEN3 for the ectopic centromere strain as PCR amplification confirmed deletion of the locus.
Figure 8.
Figure 8.
Cohesins are protected from removal during meiosis I within the 50-kb pericentromere. A strain carrying the pSPS1-PDS1dbΔ allele (A10008) was sporulated in duplicate. Samples were taken after 5 and 10 h for ChIP. (A) The binding ratios of immunoprecipitated Rec8-3HA for the pericentromere and an arm region of chromosome II. Binding ratios for the samples taken at 5 h are shown (black) as well as those taken at 10 h (red). Binding ratios for Sgo1 (dark gray) taken from the experiment in Figure 1 are also shown in addition to binding ratios for a strain lacking the tag (light gray). (B) The ratio of the binding ratio for REC8-3HA at 10 h (metaphase II-enriched cells) to the binding ratio at 5 h (metaphase I-enriched cells) for all 16 chromosomes with SGD coordinates relative to the centromere of each chromosome. Regions where the ratio of these binding ratios is high indicate portions of the genome that are more enriched for cohesins at 10 h. Raw data (Ratio Meta I/Ratio Meta II, black) are shown along with a smoothed line (Ratio Meta I/Ratio Meta II, red) created by averaging data over a moving 20-point window. A full “metachromosome” is shown (left) in addition to a version including only the 200 kb surrounding the centromere (right). (C) The binding ratio for SGO1-6HA for all 16 chromosomes with SGD coordinates relative to the centromere of each chromosome. The data are identical to that represented in Supplementary Figure 3. Raw data (black) are shown along with a smoothed line created by averaging data over a moving 10-point window. A full “metachromosome” is shown (left) in addition to a version including only the 200 kb surrounding the centromere (right).

References

    1. Aagaard L., Schmid, M., Warburton, P., and Jenuwein, T. 2000. Mitotic phosphorylation of SUV39H1, a novel component of active centromeres, coincides with transient accumulation at mammalian centromeres. J. Cell Sci. 113: 817-829. - PubMed
    1. Amor D.J. and Choo, K.H. 2002. Neocentromeres: Role in human disease, evolution, and centromere study. Am. J. Hum. Genet. 71: 695-714. - PMC - PubMed
    1. Bernard P., Maure, J.F., and Javerzat, J.P. 2001. Fission yeast Bub1 is essential in setting up the meiotic pattern of chromosome segregation. Nat. Cell Biol. 3: 522-526. - PubMed
    1. Blower M.D. and Karpen, G.H. 2001. The role of Drosophila CID in kinetochore formation, cell-cycle progression and heterochromatin interactions. Nat. Cell Biol. 3: 730-739. - PMC - PubMed
    1. Buonomo S.B., Clyne, R.K., Fuchs, J., Loidl, J., Uhlmann, F., and Nasmyth, K. 2000. Disjunction of homologous chromosomes in meiosis I depends on proteolytic cleavage of the meiotic cohesin Rec8 by separin. Cell 103: 387-398. - PubMed

Publication types

MeSH terms