. 2005 Dec 15;19(24):3070-82.
doi: 10.1101/gad.359305.

Inactivation of S6 ribosomal protein gene in T lymphocytes activates a p53-dependent checkpoint response

Affiliations

Inactivation of S6 ribosomal protein gene in T lymphocytes activates a p53-dependent checkpoint response

Sanda Sulic et al. Genes Dev. .

Abstract

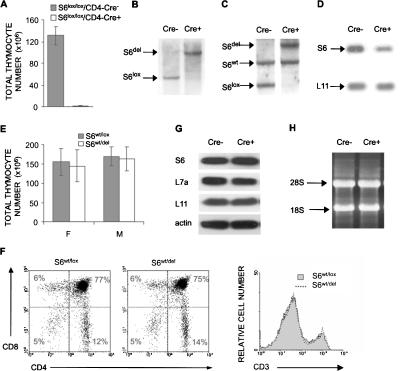
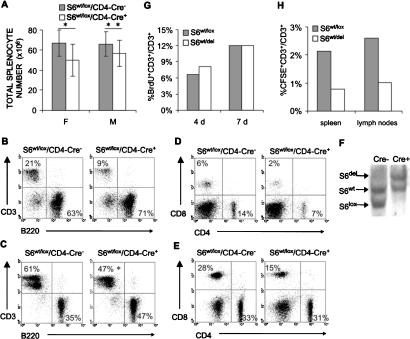
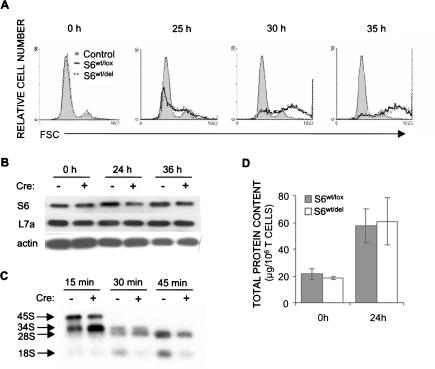
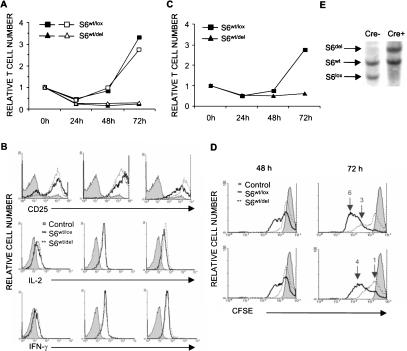
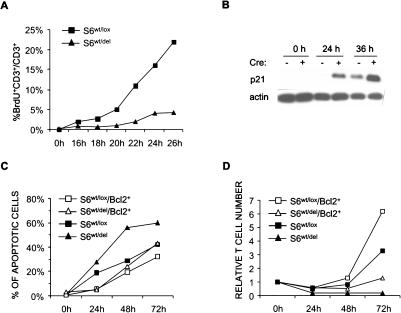
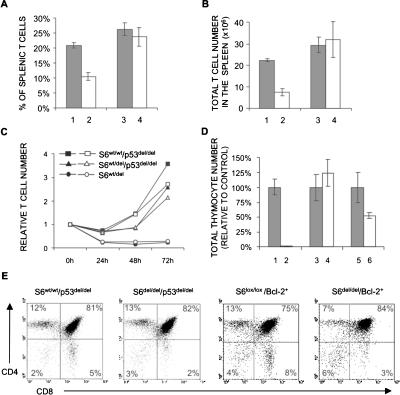
Ribosome biogenesis has been associated with regulation of cell growth and cell division, but the molecular mechanisms that integrate the effect of ribosome biogenesis on these processes in mammalian cells remain unknown. To study the effect of impaired ribosome functions in vivo, we conditionally deleted one or two alleles of the 40S ribosomal protein S6 gene in T cells in the mouse. While complete deletion of S6 abrogated T-cell development, hemizygous expression did not have any effect on T-cell maturation in the thymus, but inhibited the accumulation of T cells in the spleen and lymph nodes, as a result of their decreased survival in the peripheral lymphoid organs. Additionally, TCR-mediated stimulation of S6-heterozygous T cells induced a normal increase in their size, but cell cycle progression was impaired. Genetic inactivation of p53 tumor suppressor rescued development of S6-homozygous null thymocytes and proliferative defect of S6-heterozygous T cells. These results demonstrate the existence of a p53-dependent checkpoint mechanism that senses changes in the fidelity of the translational machinery to prevent aberrant cell division or eliminate defective T cells in vivo. Failure to activate this checkpoint response could potentially lead to a development of pathological processes such as tumors and autoimmune diseases.


Figures

Figure 1.
Figure 1.
Conditional deletion of the S6 gene in the thymus. (A) Total number of thymocytes in S6lox/lox/CD4-Cre- and S6lox/lox/CD4-Cre+ mice (n = 14 and 10, respectively). (B) Southern blot analysis of genomic DNA from pooled thymi of S6lox/lox/CD4-Cre+ and S6lox/lox/CD4-Cre- mice using S6 intron-specific probe. The positions of DNA fragments representing S6del and S6lox are shown. (C) Southern blot analysis of genomic DNA from S6wt/lox/CD4-Cre- and S6wt/lox/CD4-Cre+ thymi using S6 intron-specific probe. The positions of DNA fragments representing S6del, S6lox, and S6wt alleles are indicated. (D) Northern blot analysis of total RNA from S6wt/lox/CD4-Cre- and S6wt/lox/CD4-Cre+ thymi using S6 cDNA as a probe. The L11 cDNA probe was used as a control for loading the same quantity of total RNA on the gel. (E) Total number of thymocytes from S6wt/lox/CD4-Cre- and S6wt/lox/CD4-Cre+ mice. (F) S6wt/lox/CD4-Cre- and S6wt/lox/CD4-Cre+ thymocytes were stained with CD4 and CD8 antibodies (left panel) or anti-CD3 antibodies (right panel), and analyzed by FACS. Cell surface markers are shown as coordinates. The numbers in the quadrant refer to the percentage of a particular T-cell population of live cells. (G) The protein expression of ribosomal proteins S6, L7a, and L11 in thymocytes from S6wt/lox/CD4-Cre+ and S6wt/lox/CD4-Cre- mice was analyzed by Western blot. Reprobing with antibodies to actin served as a loading control. (H) Total RNA from 15 × 106 S6wt/lox/CD4-Cre+ and S6wt/lox/CD4-Cre- thymocytes was separated in agarose gel containing formaldehyde, transferred to a nitrocellulose membrane, and stained with ethidium bromide. Positions of 28S and 18S rRNAs are shown.
Figure 2.
Figure 2.
Decreased number of S6wt/del T cells in the spleen and lymph nodes is a consequence of their decreased survival. (A) Total cell number in spleens from female (F) and male (M) S6wt/lox/CD4-Cre- and S6wt/lox/CD4-Cre+ mice (n = 10, for each group). Error bars represent standard deviation. For females, (*) p < 0.05 versus S6wt/lox/CD4-Cre- splenocytes; and for males, (**) p > 0.05 versus S6wt/lox/CD4-Cre- splenocytes (Mann Whitney U-test). (B,D) FACS analysis of cells from S6wt/lox/CD4-Cre- and S6wt/lox/CD4-Cre+ spleens. (C,E) FACS analysis of cells from S6wt/lox/CD4-Cre- and S6wt/lox/CD4-Cre+ lymph nodes (n = 35, for each group). (*) p < 0.001 versus S6wt/lox/CD4-Cre- CD3+ cells (t-test). Genotypes are as indicated above the panels. Cell surface markers are shown as coordinates. The numbers in quadrants refer to percentage of respective cell population of live cells. (F) Southern blot analysis of genomic DNA from S6wt/lox/CD4-Cre- and S6wt/lox/CD4-Cre+ T cells purified from lymph nodes of 8-wk-old mice using the S6 intron-specific probe. (G) Six-week-old S6wt/lox/CD4-Cre- and S6wt/lox/CD4-Cre+ mice were daily injected intraperitoneally with 100 μg/g of body weight 5-BrdU (Sigma) in 200 μL of PBS during the indicated time periods; 5-BrdU incorporation into DNA was determined by flow cytometry. The percentages of 5-BrdU-positive lymph node T cells are shown. The experiment is a representative of four independent experiments. (H) CFSE-labeled S6wt/lox/CD4-Cre+ or S6wt/lox/CD4-Cre+ T cells (10 × 106) were transferred into wild-type recipients by intravenous injection, and the percentage of CFSE-labeled T cells was determined in spleens. The total number of T cells in different recipients was similar. The experiment is a representative of three independent experiments.
Figure 3.
Figure 3.
T-cell receptor-stimulated ribosome biogenesis is decreased in S6wt/del T cells, but their growth is normal. (A) FSC analysis of S6wt/lox and S6wt/del lymph node T cells stimulated with soluble 1 μg/mL anti-CD3 and 0.1 μg/mL anti-CD28 in vitro was used to determine their size. (B) The protein expression of ribosomal proteins S6 and L7a in lysates from unstimulated (0 h) and stimulated (24 and 36 h) lymph node S6wt/del and S6wt/lox T cells was analyzed by Western blot. Reprobing with antibodies to actin served as a loading control. (C) To gain insight into rRNA processing, S6wt/del and S6wt/lox T cells were stimulated for 20 h with TCR and CD28 antibodies, pulse-labeled with L-[methyl-3H]methionine for 30 min, and chased in nonradioactive medium for the indicated time. Total RNA normalized to equal cell number was resolved on a formaldehyde-agarose gel, transferred to a nylon membrane, and visualized by autoradiography. The positions of major precursors and 28S and 18S rRNA species are indicated on the left. The experiment is a representative of five independent experiments. (D) Total cellular protein content per 1 × 10⁶ S6wt/lox or S6wt/del lymph node T cells before stimulation and after 24 h of stimulation with antibodies against TCR and CD28. The experiment is a representative of six independent experiments.
Figure 4.
Figure 4.
Stimulation of S6wt/del T cells does not increase their cell number. (A) Relative number of S6wt/lox and S6wt/del T cells stimulated with either 0.1 μg (open symbols) or 1 μg/mL (closed symbols) of anti-CD3 and fixed concentration of anti-CD28 antibodies (0.1 μg/mL) during 72 h in vitro. The experiment is a representative of 15 independent experiments. (B) FACS analysis of expression levels of CD25, intracellular IL-2, and IFN-γ in S6wt/lox and S6wt/del lymph node T cells stimulated for the indicated period of time in vitro. (C) Relative number of S6wt/lox and S6wt/del lymph node T cells stimulated with soluble anti-CD3 antibodies and saturating concentration of IL-2 containing MLA-144 supernatant (1:2 dilution). The experiment is a representative of three independent experiments. (D) FACS analysis of lymph node T cells that were stimulated with different concentrations of anti-CD3 (1 μg/mL, upper panel; 0.1 μg/mL, lower panel) and anti-CD28 antibodies (0.1 μg/mL) and labeled with CFSE. The filled area represents CFSE labeling of T cells before they divided for the first time. The number of cell divisions is indicated above the peaks. (E) Southern blot analysis of genomic DNA from S6wt/lox and S6wt/del lymph node T-cell cultures at 72 h following stimulation.
Figure 5.
Figure 5.
Defect in proliferation of S6wt/del T cells is due to p21-induced G1/S block. (A) BrdU incorporation into lymph node T cells stimulated with anti-CD3- and IL-2-containing MLA144 supernatant in vitro. The experiment is a representative of four independent experiments. (B) The protein expression of p21 cell cycle inhibitor in lysates from resting and stimulated lymph node S6wt/del and S6wt/lox T cells was analyzed by Western blot. Reprobing with antibodies to actin served as a loading control. (C) T cells of indicated genotypes were stimulated for the indicated period of time, labeled with propidium iodide, and analyzed by FACS. The percentage of apoptotic cells was determined by analyzing sub-G1 DNA content. The experiment is a representative of four independent experiments. (D) Relative number of S6wt/lox, S6wt/del, S6wt/lox/Bcl-2+, and S6wt/del/Bcl-2+ T cells stimulated with anti-CD3 and anti-CD28 antibodies for 24, 48, and 72 h. The experiment is a representative of three independent experiments.
Figure 6.
Figure 6.
A p53-dependent checkpoint is activated following inactivation of one or two S6 alleles in T cells. The percentage (A) and total number (B) of T cells in spleens from S6wt/lox/CD4-Cre- (line 1), S6wt/lox/CD4-Cre+ (line 2), S6wt/wt/p53lox/lox/CD4-Cre+ (line 3), and S6wt/lox/p53lox/lox/CD4-Cre+ (line 4) 7-wk-old mice (n = 12 mice per each genotype). (C) Relative number of S6wt/lox/CD4-Cre+, S6wtwt/p53lox/lox/CD4-Cre+, and S6wt/lox/p53lox/lox/CD4-Cre+ T cells at 24, 48, and 72 h after stimulation with either 0.3 μg/mL (open symbols) or 1 μg/mL (closed symbols) of anti-CD3 and fixed concentration of anti-CD28 antibodies (0.1 μg/mL). The experiment is a representative of six independent experiments. (D) Total number of cells in thymi from S6lox/lox/CD4-Cre- (line 1), S6lox/lox/CD4-Cre+ (line 2), S6wt/wt/p53lox/lox/CD4-Cre+ (line 3), S6lox/lox/p53lox/lox/CD4-Cre+ (line 4), S6lox/lox/Bcl-2+/CD4-Cre- (line 5), and S6lox/lox/Bcl-2+/CD4-Cre+ (line 6) mice (n = 10 mice per each genotype). (E) S6wt/wt/p53lox/lox/CD4-Cre+, S6lox/lox/p53lox/lox/CD4-Cre+, S6lox/lox/Bcl-2+/CD4-Cre-, and S6lox/lox/Bcl-2+/CD4-Cre+ thymocytes were stained with anti-CD4 and anti-CD8 antibodies, and analyzed by FACS. Cell surface markers are shown as coordinates. The numbers in the quadrant refer to the percentage of a particular T-cell population of live cells.

References

    1. Amsterdam A., Sadler, K.C., Lai, K., Farrington, S., Bronson, R.T., Lees, J.A., and Hopkins, N. 2004. Many ribosomal protein genes are cancer genes in zebrafish. PloS. Biol. 2: 690-698. - PMC - PubMed
    1. Bhat K.P., Itahana, K., Jin, A., and Zhang, Y. 2004. Essential role for ribosomal protein L11 in mediating growth inhibition-induced p53 activation. EMBO J. 23: 2402-2412. - PMC - PubMed
    1. Conlon I. and Raff, M. 1999. Size control in animal development. Cell 96: 235-244. - PubMed
    1. Conlon I., Dunn, G.A., Mudge, A.W., and Raff, M. 2001. Extracellular control of cell size. Nat. Cell Biol. 3: 918-921. - PubMed
    1. Draptchinskaia N., Gustavsson, P., Andersson, B., Pettersson, M., Willig, T.N., Dianzani, I., Ball, S., Tchernia, G., Klar, J., Matsson, H., et al. 1999. The gene encoding ribosomal protein S19 is mutated in Diamond-Blackfan anaemia. Nat. Genet. 21: 169-175. - PubMed

Publication types

MeSH terms

Substances