. 2006 Jan 7;51(1):1-20.
doi: 10.1088/0031-9155/51/1/001. Epub 2005 Dec 15.

An RF phased array applicator designed for hyperthermia breast cancer treatments

Affiliations

An RF phased array applicator designed for hyperthermia breast cancer treatments

Liyong Wu et al. Phys Med Biol. .

Abstract

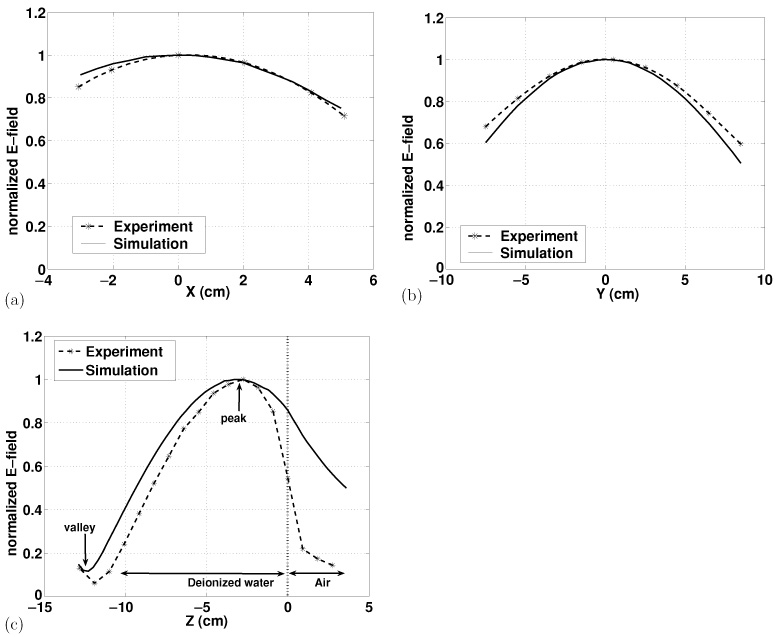
An RF phased array applicator has been constructed for hyperthermia treatments in the intact breast. This RF phased array consists of four antennas mounted on a Lexan water tank, and geometric focusing is employed so that each antenna points in the direction of the intended target. The operating frequency for this phased array is 140 MHz. The RF array has been characterized both by electric field measurements in a water tank and by electric field simulations using the finite-element method. The finite-element simulations are performed with HFSS software, where the mesh defined for finite-element calculations includes the geometry of the tank enclosure and four end-loaded dipole antennas. The material properties of the water tank enclosure and the antennas are also included in each simulation. The results of the finite-element simulations are compared to the measured values for this configuration, and the results, which include the effects of amplitude shading and phase shifting, show that the electric field predicted by finite-element simulations is similar to the measured field. Simulations also show that the contributions from standing waves are significant, which is consistent with measurement results. Simulated electric field and bio-heat transfer results are also computed within a simple 3D breast model. Temperature simulations show that, although peak temperatures are generated outside the simulated tumour target, this RF phased array applicator is an effective device for regional hyperthermia in the intact breast.


Figures

Figure 1.
Figure 1.
Four-antenna RF phased array prototype designed for hyperthermia treatments in the intact breast.
Figure 2.
Figure 2.
RF phased array amplifier system. This rack-mounted system consists of a signal generator, a vector voltmeter, a multiplexer/switch box and four RF power amplifiers. The signal source generates a common excitation frequency for each of the amplifiers, the vector voltmeter provides phase and power feedback, and the multiplexer/switch box combination controls the inputs to the RF amplifiers. In turn, the RF amplifiers drive the individual antennas in the phased array applicator.
Figure 3.
Figure 3.
Three E-field array probes are attached to a Plexiglas rod for measurements of the electric field produced by the RF applicator. This probe arrangement is scanned across a rectilinear grid within the water tank by a computer-controlled positioning system. The measurements obtained with these scans characterize the E-field distribution generated by the RF phased array.
Figure 4.
Figure 4.
Simulation model for the four-antenna RF phased array applicator. The geometric model, which has the same dimensions as the applicator in figure 1, defines the input parameters for finite-element simulations.
Figure 5.
Figure 5.
Schematic of the breast model defined for FEM simulations. The breast is modelled by a hemisphere with a 75 mm radius, and a spherical tumour model with a 25 mm radius is located inside the breast. The hemispherical breast model is attached to a 5 mm thick skin layer, a 25 mm thick fat layer and a 42 mm thick muscle layer.
Figure 6.
Figure 6.
E-field distributions generated by the RF phased array depicted in figure 1. The applicator prototype operates at 140 MHz, producing a focus at the centre of a tank filled with deionized water. The E-field measurements are performed by the apparatus depicted in figure 3, and the E-field is computed with the finite-element method for uniform phase and amplitude inputs. The finite-element simulations successfully reproduce the total measured E-field in all three directions. Measured (dashed line) and simulated (solid line) E-field values in the water tank are plotted with respect to (a) the x coordinate where y = 0 and z = −3 cm, (b) the y coordinate where x = 0 and z = −3 cm, and (c) the z coordinate where x = 0 and y = 0 cm. In particular, (c) shows that the finite-element calculations predict the locations of the maximum and minimum E-field magnitudes along the z-axis.
Figure 7.
Figure 7.
Examples of measured (a) and simulated (b) 140 MHz E-fields in the xy plane achieved through electronic steering. Although some differences appear near the far corners of the grid, the shapes of these E-field meshes are quite similar, particularly in the region near the peak. In (a) and (b), the E-field is measured 3 cm below the water surface (z = −3 cm).
Figure 8.
Figure 8.
Simulated (a) E-field, (b) SAR and (c) temperature distributions generated by the RF phased array applicator and evaluated in the x = 0 plane of the breast tumour model, where the white contours indicate the external outlines of the breast and tumour. These simulation results show that, in the x = 0 plane, the E-field peaks in water are near the source antennas, the E-field peaks in tissue are near the skin surface, the peak SAR values are within the tumour model and near the skin surface, and the peak temperature in the x = 0 plane (the peak temperature in this plane is 42.5 °C) is within the tumour boundary.
Figure 9.
Figure 9.
Simulated (a) E-field, (b) SAR and (c) temperature distributions generated by the RF phased array applicator and evaluated in the y = −16 mm plane of the breast tumour model. In the y = −16 mm plane, E-field peaks in tissue appear in fat near the tumour interface, peak SAR values are in fat near the tumour interface and in the tumour proximal to the applicator, and the peak temperature in the y = 0 plane is located in fat near the tumour interface. The peak temperature in this figure, which is also the peak overall temperature, is 43.6 °C.

References

    1. Carter DL, MacFall JR, Clegg ST, Wan X, Prescott DM, Charles HC, Samulski TV. Magnetic resonance thermometry during hyperthermia for human high-grade sarcoma. Int. J. Radiat. Oncol. Biol. Phys. 1998;40:815–822. - PubMed
    1. Clegg ST, Das SK, Fuller E, Anderson S, Blivin J, Oleson JR, Samulski TV. Hyperthermia treatment planning and temperature distribution reconstruction: a case study. Int. J. Hyperthermia. 1996;12:65–76. - PubMed
    1. Das SK, Clegg ST, Samulski TV. Electromagnetic thermal therapy power optimization for multiple source applicators. Int. J. Hyperthermia. 1999a;15:291–308. - PubMed
    1. Das SK, Clegg ST, Samulski TV. Computational techniques for fast hyperthermia temperature optimization. Med. Phys. 1999b;26:319–328. - PubMed
    1. Ebbini ES, Cain CA. Multiple-focus ultrasound phased-array pattern synthesis: optimal driving signal distributions for hyperthermia. IEEE Trans. Ultrason. Ferroelectr. Freq. Control. 1989;36:540–548. - PubMed