

Automated decision tree classification of corneal shape
- PMID: 16357645
- PMCID: PMC3073139
- DOI: 10.1097/01.opx.0000192350.01045.6f
Automated decision tree classification of corneal shape
Abstract
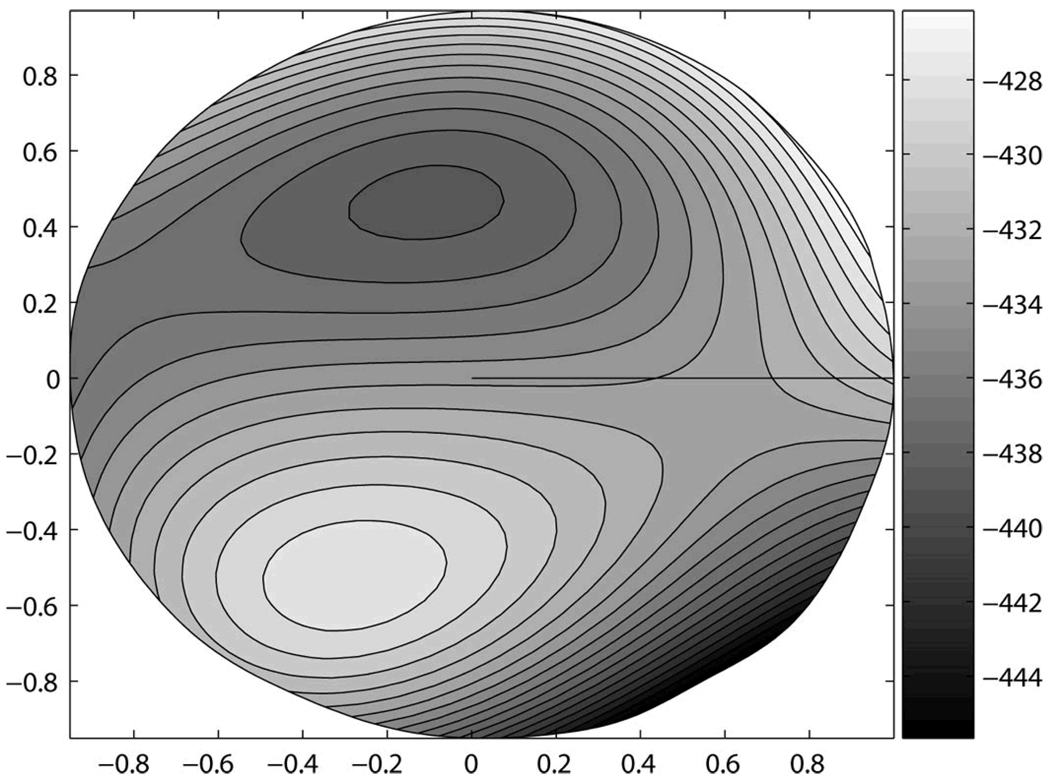
Purpose: The volume and complexity of data produced during videokeratography examinations present a challenge of interpretation. As a consequence, results are often analyzed qualitatively by subjective pattern recognition or reduced to comparisons of summary indices. We describe the application of decision tree induction, an automated machine learning classification method, to discriminate between normal and keratoconic corneal shapes in an objective and quantitative way. We then compared this method with other known classification methods.
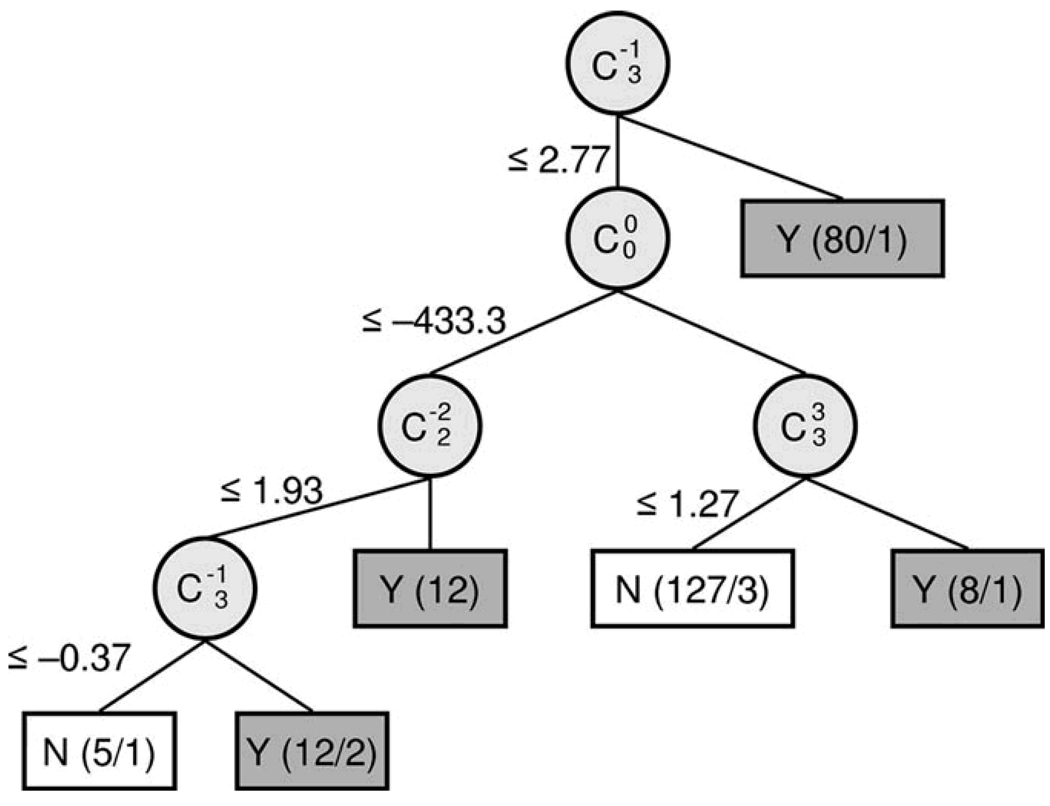
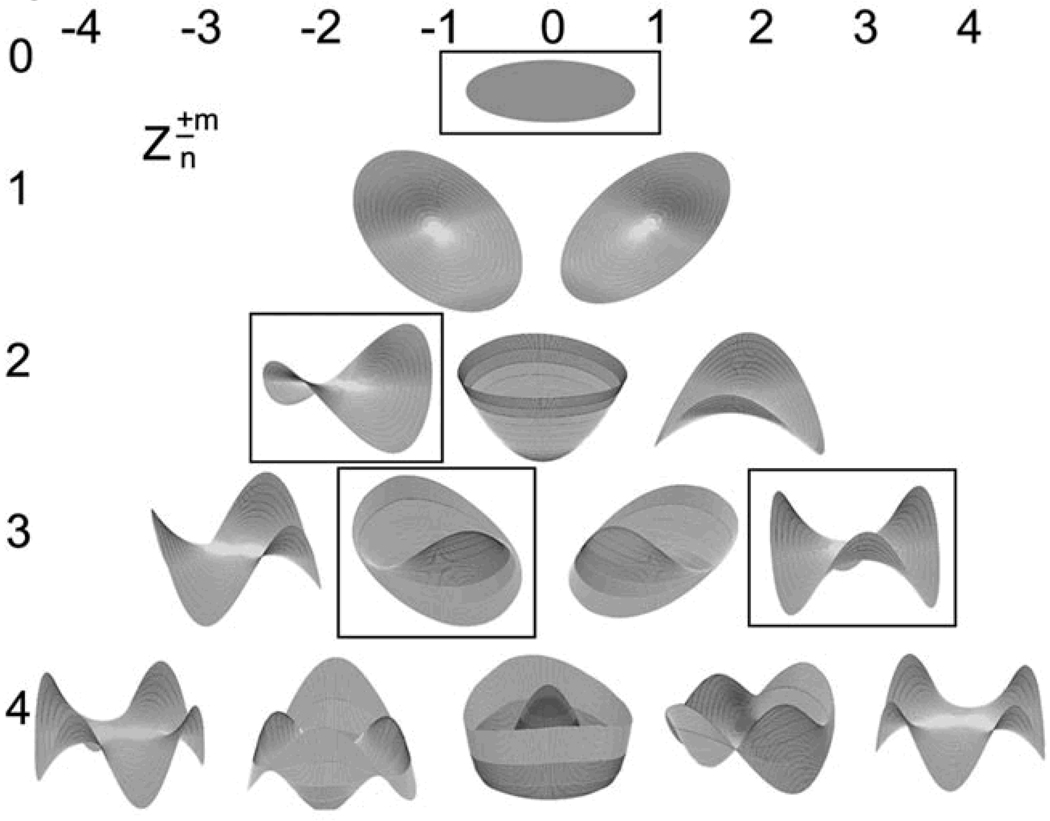
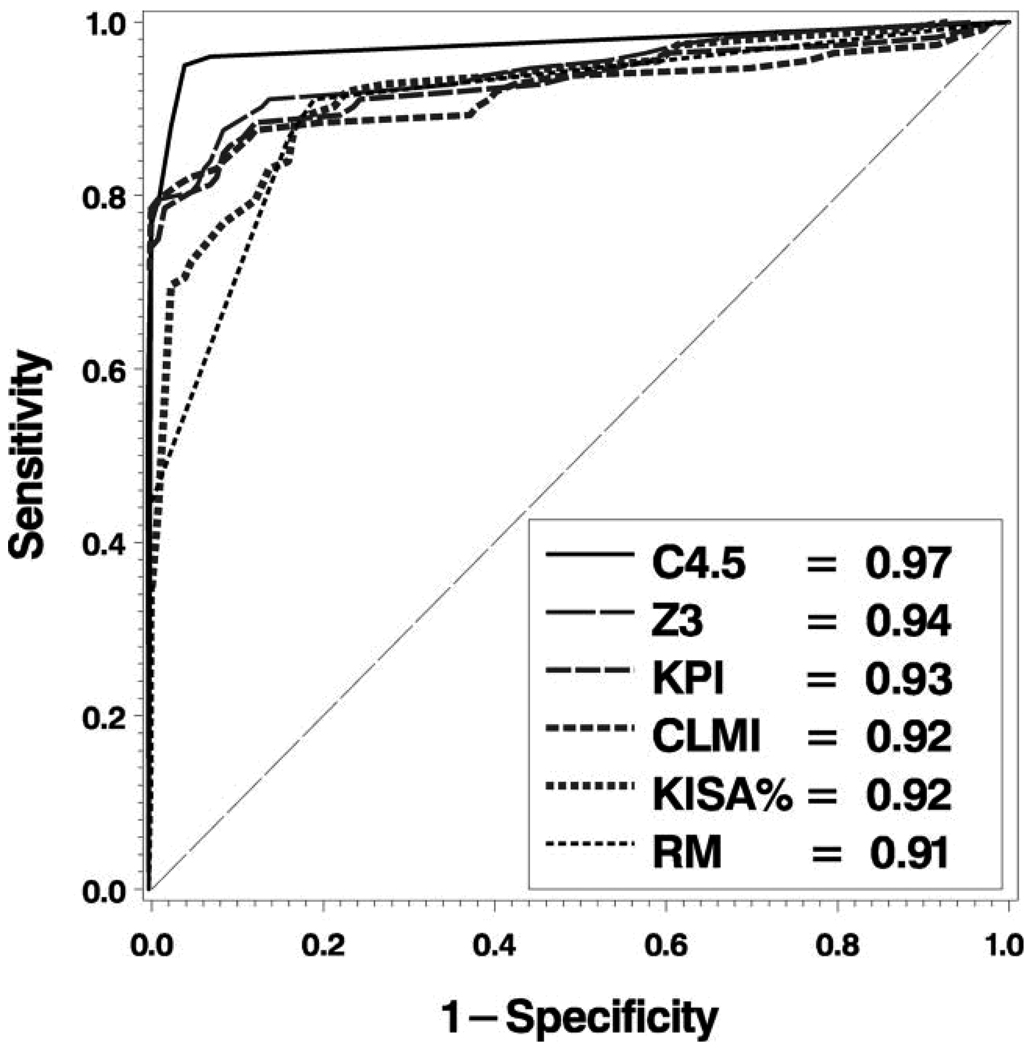
Methods: The corneal surface was modeled with a seventh-order Zernike polynomial for 132 normal eyes of 92 subjects and 112 eyes of 71 subjects diagnosed with keratoconus. A decision tree classifier was induced using the C4.5 algorithm, and its classification performance was compared with the modified Rabinowitz-McDonnell index, Schwiegerling's Z3 index (Z3), Keratoconus Prediction Index (KPI), KISA%, and Cone Location and Magnitude Index using recommended classification thresholds for each method. We also evaluated the area under the receiver operator characteristic (ROC) curve for each classification method.
Results: Our decision tree classifier performed equal to or better than the other classifiers tested: accuracy was 92% and the area under the ROC curve was 0.97. Our decision tree classifier reduced the information needed to distinguish between normal and keratoconus eyes using four of 36 Zernike polynomial coefficients. The four surface features selected as classification attributes by the decision tree method were inferior elevation, greater sagittal depth, oblique toricity, and trefoil.
Conclusion: Automated decision tree classification of corneal shape through Zernike polynomials is an accurate quantitative method of classification that is interpretable and can be generated from any instrument platform capable of raw elevation data output. This method of pattern classification is extendable to other classification problems.
Conflict of interest statement
Figures
References
-
- Dingeldein SA, Klyce SD, Wilson SE. Quantitative descriptors of corneal shape derived from computer- assisted analysis of photokeratographs. Refract Corneal Surg. 1989;5:372–378. - PubMed
-
- Klyce SD, Wilson SE. Methods of analysis of corneal topography. Refract Corneal Surg. 1989;5:368–371. - PubMed
-
- Rabinowitz YS, McDonnell PJ. Computer-assisted corneal topography in keratoconus. Refract Corneal Surg. 1989;5:400–408. - PubMed
-
- Wilson SE, Klyce SD. Quantitative descriptors of corneal topography. A clinical study. Arch Ophthalmol. 1991;109:349–353. - PubMed
-
- Carroll JP. A method to describe corneal topography. Optom Vis Sci. 1994;71:259–264. - PubMed
Publication types
MeSH terms
Grants and funding
LinkOut - more resources
Full Text Sources
Other Literature Sources
Medical
Research Materials
Miscellaneous
