Role of arginine residues 14 and 15 in dictating DNA binding stability and transactivation of the aryl hydrocarbon receptor/aryl hydrocarbon receptor nuclear translocator heterodimer
- PMID: 16358414
- PMCID: PMC6009124
- DOI: 10.3727/000000005783991981
Role of arginine residues 14 and 15 in dictating DNA binding stability and transactivation of the aryl hydrocarbon receptor/aryl hydrocarbon receptor nuclear translocator heterodimer
Abstract
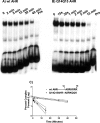
The aryl hydrocarbon receptor (AHR) and its DNA binding partner, the aryl hydrocarbon receptor nuclear translocator (ARNT) are basic helix-loop-helix/PAS proteins. The goal of the current study was to determine the extent to which residues R14 and R15 contained within the basic region of the AHR contribute to the DNA binding affinity and stability of the AHR/ARNT heterodimer. Towards this end, we first performed equilibrium binding and dissociation rate analyses using a single dioxin response element (DRE-1). While the K(D) and Bmax values obtained from the equilibrium binding analysis were similar for the wild-type AHR (wt AHR) and that containing the substitutions of R14 and R15 with Q residues (Q14Q15 AHR), dissociation rate analyses revealed that the stability of the Q14Q15 AHR DNA binding complex was approximately 10-fold less. Using a two-site DNA binding model, we also found that AHR/ARNT heterodimer does not participate in cooperative binding, as binding of the second dimer appears to be prohibited by occupation of the first. This property was similar regardless of the composition of the amino acids at positions 14 and 15. Finally, reporter assays revealed that the Q14Q15 substitutions severely compromised the ability of the AHR to activate gene expression despite appropriate nuclear localization. The present results revealed that DNA binding stability of the AHR/ARNT heterodimer is an important requirement for its transactivation capabilities and that this stability is governed, in part, by residues R14 and R15 that lie within the basic region of the AHR.
Figures


Similar articles
-
Functional analysis of aryl hydrocarbon receptor nuclear translocator interactions with aryl hydrocarbon receptor in the yeast two-hybrid system.Biochem Pharmacol. 1995 Oct 12;50(8):1295-302. doi: 10.1016/0006-2952(95)02016-6. Biochem Pharmacol. 1995. PMID: 7488247
-
Functional characterization of DNA-binding domains of the subunits of the heterodimeric aryl hydrocarbon receptor complex imputing novel and canonical basic helix-loop-helix protein-DNA interactions.J Biol Chem. 1996 Apr 12;271(15):8843-50. doi: 10.1074/jbc.271.15.8843. J Biol Chem. 1996. PMID: 8621524
-
DNA binding and protein interactions of the AHR/ARNT heterodimer that facilitate gene activation.Chem Biol Interact. 2002 Sep 20;141(1-2):63-76. doi: 10.1016/s0009-2797(02)00066-2. Chem Biol Interact. 2002. PMID: 12213385 Review.
-
Trans-activation by the human aryl hydrocarbon receptor and aryl hydrocarbon receptor nuclear translocator proteins: direct interactions with basal transcription factors.Mol Pharmacol. 1996 Sep;50(3):538-48. Mol Pharmacol. 1996. PMID: 8794892
-
The aryl hydrocarbon receptor complex and the control of gene expression.Crit Rev Eukaryot Gene Expr. 2008;18(3):207-50. doi: 10.1615/critreveukargeneexpr.v18.i3.20. Crit Rev Eukaryot Gene Expr. 2008. PMID: 18540824 Free PMC article. Review.
Cited by
-
Hypoxia inducible factor 1alpha gene (HIF-1alpha) splice variants: potential prognostic biomarkers in breast cancer.BMC Med. 2010 Jul 12;8:44. doi: 10.1186/1741-7015-8-44. BMC Med. 2010. PMID: 20624301 Free PMC article.
-
Structural modeling of the AhR:ARNT complex in the bHLH-PASA-PASB region elucidates the key determinants of dimerization.Mol Biosyst. 2017 May 2;13(5):981-990. doi: 10.1039/c7mb00005g. Mol Biosyst. 2017. PMID: 28393157 Free PMC article.
-
Novel FOXF1 mutations in sporadic and familial cases of alveolar capillary dysplasia with misaligned pulmonary veins imply a role for its DNA binding domain.Hum Mutat. 2013 Jun;34(6):801-11. doi: 10.1002/humu.22313. Epub 2013 Apr 12. Hum Mutat. 2013. PMID: 23505205 Free PMC article.
References
-
- Atchley W. R.; Wollenberg K. R.; Fitch W. M.; Terhalle W.; Dress A. W. Correlations among amino acid sites in bHLH protein domains: An information theoretic analysis. Mol. Biol. Evol. 17:164–178; 2000. - PubMed
-
- Bacsi S. G.; Hankinson O. Functional characterization of DNA-binding domains of the subunits of the heterodimeric aryl hydrocarbon receptor complex imputing novel and canonical basic helix–loop–helix protein–DNA interactions. J. Biol. Chem. 271:8843–8850; 1996. - PubMed
-
- Chan W. K.; Chu R.; Jain S.; Reddy J. K.; Bradfield C. A. Baculovirus expression of the Ah receptor and Ah receptor nuclear translocater. Evidence for additional dioxin responsive element-binding species and factors required for signaling. J. Biol. Chem. 269:26464–26471; 1994. - PubMed
-
- Chapman-Smith A.; Lutwyche J. L.; Whitelaw M. L. Contribution of the Per/Arnt/Sim (PAS) domains to DNA dinding by the basic helix-loop-helix PAS transcriptional regulators. J. Biol. Chem. 279:5353–5362; 2004. - PubMed
Publication types
MeSH terms
Substances
Grants and funding
LinkOut - more resources
Full Text Sources
