. 2005 Dec 16;123(6):1037-50.
doi: 10.1016/j.cell.2005.09.034.

Chromosome sites play dual roles to establish homologous synapsis during meiosis in C. elegans

Affiliations

Chromosome sites play dual roles to establish homologous synapsis during meiosis in C. elegans

Amy J MacQueen et al. Cell. .

Abstract

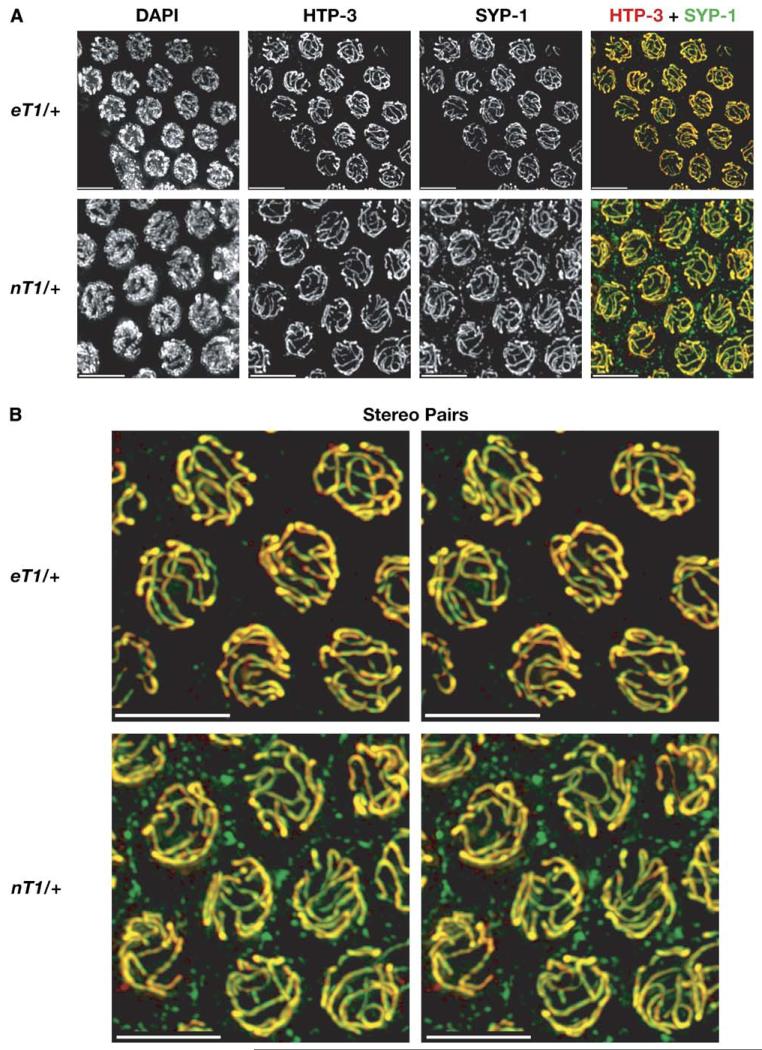
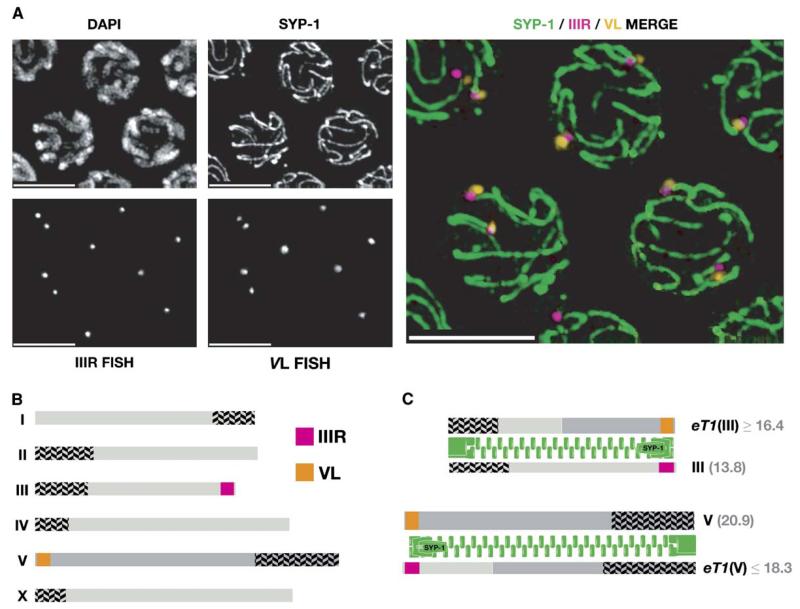
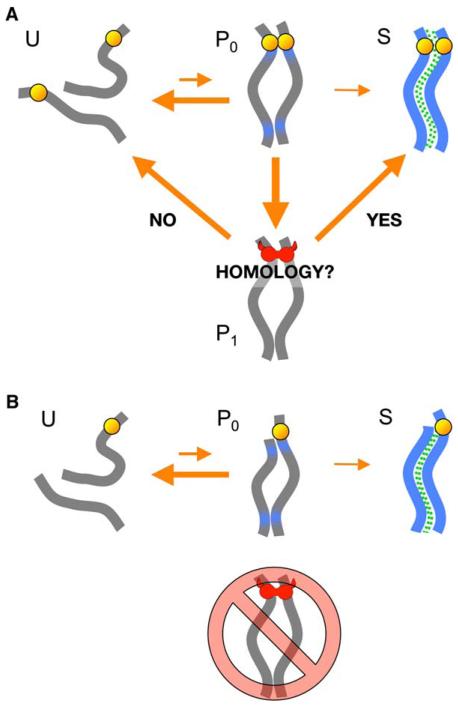
We have investigated the role of pairing centers (PCs), cis-acting sites required for accurate segregation of homologous chromosomes during meiosis in C. elegans. We find that these sites play two distinct roles that contribute to proper segregation. Chromosomes lacking PCs usually fail to synapse and also lack a synapsis-independent stabilization activity. The presence of a PC on just one copy of a chromosome pair promotes synapsis but does not support synapsis-independent pairing stabilization, indicating that these functions are separable. Once initiated, synapsis is highly processive, even between nonhomologous chromosomes of disparate lengths, elucidating how translocations suppress meiotic recombination in C. elegans. These findings suggest a multistep pathway for chromosome synapsis in which PCs impart selectivity and efficiency through a "kinetic proofreading" mechanism. We speculate that concentration of these activities at one region per chromosome may have coevolved with the loss of a point centromere to safeguard karyotype stability.


Figures

Figure 1
Figure 1. Normal and Rearranged Chromosomes Examined in This Study
(A) The wild-type haploid karyotype of C. elegans. The physical interval that contains pairing-center function on each chromosome is indicated with herringbone shading. Left and right arms of each chromosome were arbitrarily designated in early genetic studies. This diagram is similar one in Albertson et al. (1997) but has been updated to include new mapping information (this study; Edgley and Riddle, 2001; Koh et al., 2004). All gray numbers indicate megabases of DNA. (B) The X chromosome pairing-center deficiency meDf2(X) and the attached duplication mnDp66(X;I). meDf2 is a terminal or near-terminal deficiency; our SNP analysis revealed that its internal breakpoint is located between two SNP markers 1.46 and 2.06 Mb from the left end, and this region of ambiguity is indicated with light shading. (C) Reciprocal-translocation chromosomes eT1(IV;V) and nT1(IV;V). For each half-translocation chromosome, the autosome that behaves as its meiotic segregation partner is indicated in parenthesis—i.e., eT1(III) recombines with and segregates away from chromosome III and thus (by definition) carries the chromosome III pairing center. Segment lengths shown in gray are deduced from the literature: the chromosome III breakpoint is within or very close to the unc-36 locus located 8.2 Mb from the left end. The chromosome V breakpoint is not precisely known; minimal and maximal physical lengths for each segment are based on the position of intervals known to be crossover suppressed or not suppressed. The precise breakpoints of nT1 were recently mapped by Koh et al. (2004). (D) Fusion chromosomes eT6 and eT3 indicating the orientation of the PCs. Both of these are fusions between nearly intact copies of chromosomes IV and X. eT3[meDf2] is the product of exchange between eT3 and meDf2; it thus contains only the chromosome IV PC. All chromosome segments in (A)—(D) are drawn to scale based on physical coordinates from the WS140 freeze of Wormbase data from March 2005 (http://ws140.wormbase.org/).
Figure 2
Figure 2. Quantification of X Chromosome Associations in Pairing-Center Mutants
Probes from the left and right arms of the X chromosomes were hybridized to hermaphrodites of the indicated genotypes. The percent of nuclei with paired signals for each probe was measured for each of five temporal zones, as described by MacQueen and Villeneuve (2001). Zone 1 contains exclusively premeiotic nuclei, zone 2 contains both premeiotic and leptotene/zygotene stages, zone 3 represents early- to mid-pachytene stages, and zones 4 and 5 contain mid- to late-pachytene-stage nuclei. The genotypes in the top panels correspond to those in the bottom panels except that the bottom three panels show data from animals also homozygous for a syp-1 mutation, which eliminates an essential SC component. Corresponding numerical data are presented in Table S1.
Figure 3
Figure 3. X Chromosomes Lacking Pairing Centers Form Axial Elements but Only Rarely Undergo Synapsis
(A) illustrates the behavior of the proteins we have used here to visualize the axial and central elements of the SC. Axial-element proteins, including HTP-3, load onto meiotic chromosomes prior to pairing and synapsis. The presence of SYP-1, a component of the central element, defines synapsed segments. (B) and (C) show projections through fields of pachytene nuclei from gonads stained with antibodies against HTP-3 and SYP-1. (B) shows nuclei from a wild-type hermaphrodite. SYP-1 staining corresponds closely with all HTP-3 segments in the merged image, indicating an absence of unsynapsed chromosome regions. Six SCs, corresponding to the six synapsed chromosome pairs, can be detected in each nucleus. (C) shows images from a hermaphrodite homozygous for the PC deficiency meDf2. Regions of HTP-3 staining lacking SYP-1 staining can be detected in most of these nuclei, although in a small fraction of nuclei, complete synapsis with six contiguous stretches of SC is detected. Because the asynapsed regions and the difference between synapsed and asynapsed chromosomes is more easily observed in 3D images, the same region shown in (C) is displayed in (D) as a stereo pair of images. Blue arrows indicate the two nuclei in this field that are fully synapsed. In (E), in situ hybridization confirms that the X chromosomes are specifically asynapsed in meDf2 homozygotes. The X chromosome probe used here hybridizes to a region 2.2 Mb from the left end of the chromosome, which is retained on meDf2 and is not duplicated on mnDp66. In most pachytene-region nuclei, two separated X chromosome signals can be seen, in contrast to the chromosome V-derived probe, which is consistently paired. Interestingly, the X chromosome probes often colocalize with small foci of SYP-1 (two clear examples are indicated with arrows), suggesting that although SYP-1 does not polymerize along these PC-deficient chromosomes, it may load onto the chromosome end (or ends). All scale bars represent 5 μm.
Figure 4
Figure 4. Recombination Intermediates Reach Higher Steady-State Levels and Persist Later in Nuclei with Defective X Chromosome Synapsis
(A) The distribution of RAD-51 foci as a function of meiotic progression in N2 (wild-type) and meDf2 hermaphrodites was measured as in Colaiácovo et al. (2003). Each genotype is plotted independently. Gonads were divided into seven zones of equal size, which are enumerated along the x axis. (B) To facilitate comparison between the genotypes analyzed in (A), the same data were consolidated to derive a mean number of RAD-51 foci per nucleus in each zone. For (A) and (B), the total numbers of nuclei scored for each genotype were as follows (in order by zone). N2: 344, 453, 471, 373, 327, 276, 138; total = 2382. meDf2: 257, 323, 342, 364, 296, 240, 149; total = 1971. (C) RAD-51 foci are detected on unsynapsed X chromosomes. This projection displays late-pachytene nuclei from a meDf2/+ heterozygote. Two fully synapsed nuclei are indicated with small white arrows, and three nuclei with unsynapsed X chromosomes are indicated by yellow arrows. Nuclei containing unsynapsed chromosomes retain a more asymmetric chromosome distribution and display more numerous RAD-51 foci. Unsynapsed X chromosomes can be detected as brightly DAPI-stained regions that lack extensive SYP-1 staining. Late RAD-51 foci are abundant on the X chromosomes, perhaps most easily seen in the nucleus on the lower right. Scale bars represent 5 μm.
Figure 5
Figure 5. Reciprocal Translocations that Suppress Crossing-over Do Not Cause Asynapsis
These panels show immunostaining of the SC in hermaphrodites heterozygous for the reciprocal translocations eT1 and nT1 (diagrammed in Figure 1). As in wild-type animals, no regions of unsynapsed axial elements are observed. Stereo pairs of regions from the merged images are also shown because they make it easier to observe the six contiguous SCs in each nucleus and the absence of cruciform (quadrivalent) structures. All scale bars represent 5 μm.
Figure 6
Figure 6. Regions that Are Crossover-Suppressed in Reciprocal-Translocation Heterozygotes Participate in Nonhomologous Synapsis
(A) shows separate and merged images of pachytene nuclei from an eT1/+ heterozygote stained with anti-SYP-1 antibodies and hybridized with fluorescent probes to the crossover-suppressed (non-PC) ends of chromosomes III and V. As in Figure 5, six SCs are observed in each nucleus, and two of these show closely associated nonhomologous probe pairs at one end. (B) indicates the position of the probes on the wild-type karyotype. (C) illustrates the most straightforward explanation for the observations: synapsis initiates at the homologously paired PC end of the chromosomes and “zippers” up along the complete length of each chromosome pair, resulting in nonhomologous synapsis of these distal regions associated with homologous PCs. The eT1 (III)/III and eT1(V)/V pairs both involve synapsis between chromosomes of unequal length, suggesting that there is a mechanism that compacts and/or extends chromosome regions to equalize these lengths. Scale bars represent 5 μm.
Figure 7
Figure 7. A Model for the Role of PCs in Chromosome Pairing and Synapsis
(A) The normal pathway leading from unpaired (U) chromosomes to homologous synapsis (S). The P0 paired state is transient, but the P1 state is stabilized by an interaction between homologous PCs. Yellow balls represent pairing centers, and the green dashed lines represent the synaptonemal complex. The red “horns” represent the Maxwellian demon-like properties of the pairing centers at the P1 state. See the text of the Discussion for explanation. (B) An alternate pathway to synapsis when the pairing center is missing from one of two homologous chromosomes.

Comment in

Similar articles

Cited by

References

    1. Albertson DG, Rose AM, Villeneuve AM. Chromosome organization, mitosis, and meiosis. In: Riddle DL, Blumenthal T, Meyer BJ, Priess JR, editors. C. elegans II. Cold Spring Harbor Laboratory Press; Plainview, NY: 1997. pp. 47–78. - PubMed
    1. Barbazuk WB, Johnsen RC, Baillie DL. The generation and genetic analysis of suppressors of lethal mutations in the Caenorhabditis elegans rol-3(V) gene. Genetics. 1994;136:129–143. - PMC - PubMed
    1. Carlton PM, Farrugio AP, Dernburg AF. A link between meiotic prophase progression and crossover control. PLoS Genet. 2005 in press. - PMC - PubMed
    1. Colaiácovo MP, MacQueen AJ, Martinez-Perez E, McDonald K, Adamo A, La Volpe A, Villeneuve AM. Synaptonemal complex assembly in C. elegans is dispensable for loading strand-exchange proteins but critical for proper completion of recombination. Dev. Cell. 2003;5:463–474. - PubMed
    1. Couteau F, Nabeshima K, Villeneuve A, Zetka M. A component of C. elegans meiotic chromosome axes at the interface of homolog alignment, synapsis, nuclear reorganization, and recombination. Curr. Biol. 2004;14:585–592. - PubMed

Publication types

MeSH terms

Substances

LinkOut - more resources