. 2006 Mar;172(3):1385-96.
doi: 10.1534/genetics.105.051508. Epub 2005 Dec 15.

Fold recognition of the human immunodeficiency virus type 1 V3 loop and flexibility of its crown structure during the course of adaptation to a host

Affiliations

Fold recognition of the human immunodeficiency virus type 1 V3 loop and flexibility of its crown structure during the course of adaptation to a host

Teruaki Watabe et al. Genetics. 2006 Mar.

Abstract

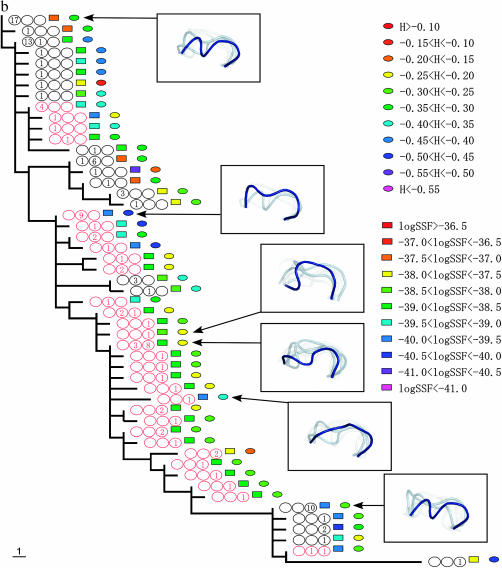
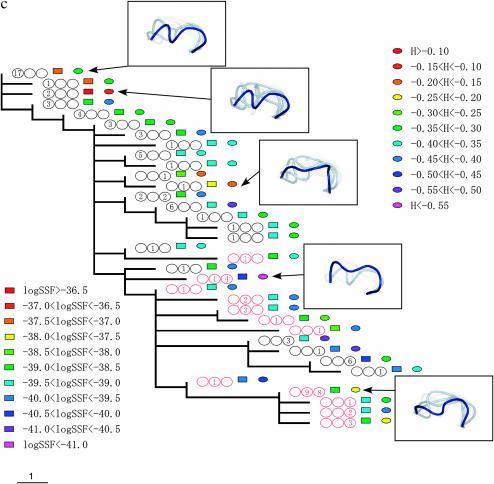
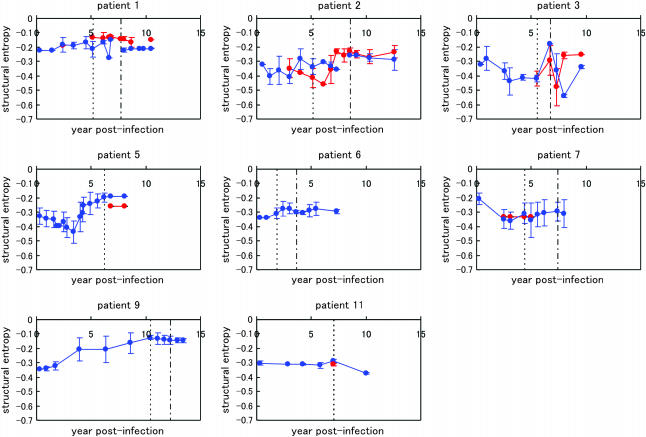
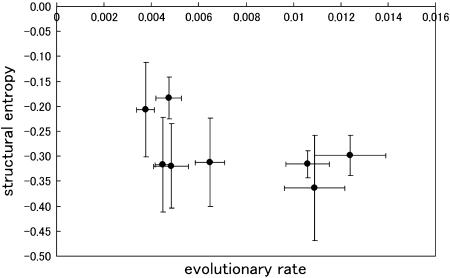
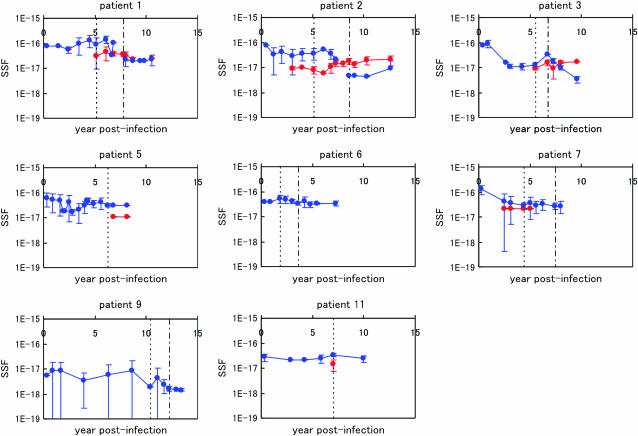
The third hypervariable (V3) region of the HIV-1 gp120 protein is responsible for many aspects of viral infectivity. The tertiary structure of the V3 loop seems to influence the coreceptor usage of the virus, which is an important determinant of HIV pathogenesis. Hence, the information about preferred conformations of the V3-loop region and its flexibility could be a crucial tool for understanding the mechanisms of progression from an initial infection to AIDS. Taking into account the uncertainty of the loop structure, we predicted the structural flexibility, diversity, and sequence fitness to the V3-loop structure for each of the sequences serially sampled during an asymptomatic period. Structural diversity correlated with sequence diversity. The predicted crown structure usage implied that structural flexibility depended on the patient and that the antigenic character of the virus might be almost uniform in a patient whose immune system is strong. Furthermore, the predicted structural ensemble suggested that toward the end of the asymptomatic period there was a change in the V3-loop structure or in the environment surrounding the V3 loop, possibly because of its proximity to the gp120 core.


Figures

Figure 1.
Figure 1.
Measured structures of V3 loop and characterization of the locality around the crown region. (a) NMR-based V3-loop structures. The 20 models were superposed by use of the α-helix region (residues 318–330; in dark gray). The crown region is orange. We studied the structural ensemble of the locality consisting of the V3 loop and flanking sites (in green). (b) The five structures of the V3 crown measured in previous work (1CE4, 1NJ0, 1B03, 1ACY, and 1K5M). The three-dimensional coordinates (x, y, z) of the five crowns were set as explained in the main text. (c) Four structural parameters used to characterize the locality around the crown region.
Figure 1.
Figure 1.
Measured structures of V3 loop and characterization of the locality around the crown region. (a) NMR-based V3-loop structures. The 20 models were superposed by use of the α-helix region (residues 318–330; in dark gray). The crown region is orange. We studied the structural ensemble of the locality consisting of the V3 loop and flanking sites (in green). (b) The five structures of the V3 crown measured in previous work (1CE4, 1NJ0, 1B03, 1ACY, and 1K5M). The three-dimensional coordinates (x, y, z) of the five crowns were set as explained in the main text. (c) Four structural parameters used to characterize the locality around the crown region.
Figure 2.
Figure 2.
The phylogenic relationships between V3 amino acid sequences from patients 1 (a), 2 (b), and 3 (c). The trees were obtained by the maximum-parsimony method on the basis of the topologies of the maximum-likelihood trees of the C2–V5 region of env sequences. X4 sequences are indicated by red circles. The period in which the sequence appeared is indicated by a number in the circles, and the numbers themselves correspond to the number of sequences isolated during the specified time period. The left, middle, and right circles correspond to AIP I, II, and III, respectively. The colored squares show the range of the logarithms of SSF (“log SSF”) and the colored circles indicate the range of structural entropy (“H”). The values for structural entropy were subtracted by the value of the maximum entropy (= log 105). Some of the crown structure usages are illustrated. The crown with the highest posterior probability (in deep blue), crowns in the 10th percentile of posterior probability (in light blue), and those in the 20th percentile of posterior probability (in light gray) are shown.
Figure 2.
Figure 2.
The phylogenic relationships between V3 amino acid sequences from patients 1 (a), 2 (b), and 3 (c). The trees were obtained by the maximum-parsimony method on the basis of the topologies of the maximum-likelihood trees of the C2–V5 region of env sequences. X4 sequences are indicated by red circles. The period in which the sequence appeared is indicated by a number in the circles, and the numbers themselves correspond to the number of sequences isolated during the specified time period. The left, middle, and right circles correspond to AIP I, II, and III, respectively. The colored squares show the range of the logarithms of SSF (“log SSF”) and the colored circles indicate the range of structural entropy (“H”). The values for structural entropy were subtracted by the value of the maximum entropy (= log 105). Some of the crown structure usages are illustrated. The crown with the highest posterior probability (in deep blue), crowns in the 10th percentile of posterior probability (in light blue), and those in the 20th percentile of posterior probability (in light gray) are shown.
Figure 3.
Figure 3.
Chronological changes in the average structural entropy in the eight patients, shown with standard deviation. Data for the X4 sequences are indicated by red lines and those for the R5 sequences are in blue. The dotted vertical line for each patient indicates the border between AIP I and II, and the dotted-dashed vertical line for each patient (except patients 5 and 11) shows the border between AIP II and III. The values for structural entropy were subtracted by the value of the maximum entropy (= log 105).
Figure 4.
Figure 4.
The mean values of structural entropy, which were subtracted by the value of the maximum entropy (= log 105), compared with evolutionary rates in the eight patients.
Figure 5.
Figure 5.
Chronological changes in the average SSF in the eight patients, shown with standard deviations. The data for the X4 sequences are indicated by red lines and those for the R5 sequences are in blue. The dotted vertical line for each patient indicates the border between AIP I and II, and the dotted-dashed vertical line for each patient (except patients 5 and 11) shows the border between AIP II and III.
Figure 6.
Figure 6.
Decay of SSF during the asymptomatic period and comparison among patients. The slope values of the regression analysis were compared with the evolutionary rates in the five patients, in which the logarithms of the average sequence–structure fitness negatively correlate with the progression of infection.

Similar articles

Cited by

References

    1. Alm, E., and D. Baker, 1999. Prediction of protein-folding mechanisms from free-energy landscapes derived from native structures. Proc. Natl. Acad. Sci. USA 96: 11305–11310. - PMC - PubMed
    1. Baker, D., 2000. A surprising simplicity to protein folding. Nature 405: 39–42. - PubMed
    1. Baker, D., and A. Sali, 2001. Protein structure prediction and structural genomics. Science 294: 93–96. - PubMed
    1. Balbach, J. J., J. Yang, D. P. Weliky, P. J. Steinbach, V. Tugarinov et al., 2000. Probing hydrogen bonds in the antibody-bound HIV-1 gp120 V3 loop by solid state NMR REDOR measurements. J. Biomol. NMR 16: 313–327. - PubMed
    1. Berger, E. A., R. W. Doms, E. M. Fenyo, B. T. Korber, D. R. Littman et al., 1998. A new classification for HIV-1. Nature 391: 240. - PubMed

Publication types

Substances