. 2005 Dec 16;33(22):e192.
doi: 10.1093/nar/gni191.

Human and mouse oligonucleotide-based array CGH

Affiliations

Human and mouse oligonucleotide-based array CGH

Paul van den Ijssel et al. Nucleic Acids Res. .

Abstract

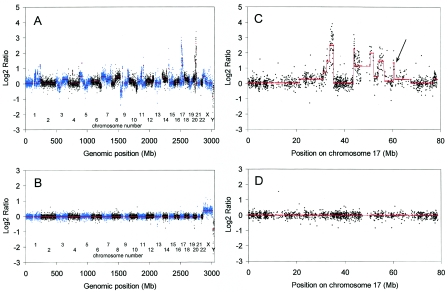
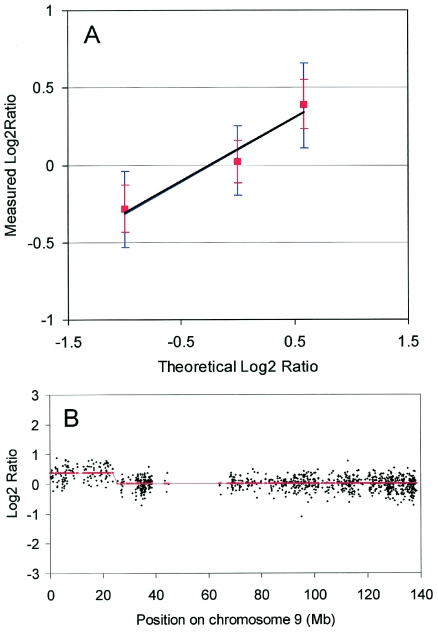
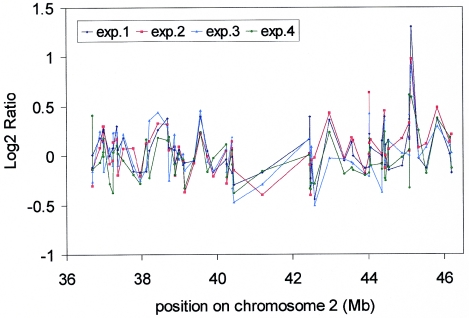
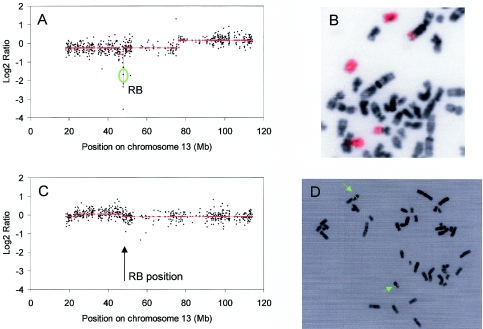
Array-based comparative genomic hybridization is a high resolution method for measuring chromosomal copy number changes. Here we present a validated protocol using in-house spotted oligonucleotide libraries for array comparative genomic hybridization (CGH). This oligo array CGH platform yields reproducible results and is capable of detecting single copy gains, multi-copy amplifications as well as homozygous and heterozygous deletions as small as 100 kb with high resolution. A human oligonucleotide library was printed on amine binding slides. Arrays were hybridized using a hybstation and analysed using BlueFuse feature extraction software, with >95% of spots passing quality control. The protocol allows as little as 300 ng of input DNA and a 90% reduction of Cot-1 DNA without compromising quality. High quality results have also been obtained with DNA from archival tissue. Finally, in addition to human oligo arrays, we have applied the protocol successfully to mouse oligo arrays. We believe that this oligo-based platform using 'off-the-shelf' oligo libraries provides an easy accessible alternative to BAC arrays for CGH, which is cost-effective, available at high resolution and easily implemented for any sequenced organism without compromising the quality of the results.


Figures

Figure 1
Figure 1
Capability of the oligo array CGH platform to detect and map chromosomal aberrations. Genome-wide profiles are shown that were obtained from hybridization of BT474 DNA (A) with human male reference DNA or (B) normal male with normal female DNA on a 29 K human oligonucleotide array. Log2ratios were calculated with a weighted moving average as described (11) using a window of 250 kb and are displayed as a function of their position in the genome. Log2ratios of the odd and even chromosomes are shown in aqua blue and black, respectively. Chromosome numbers are indicated. Smoothed values of the log2ratios were calculated using a dedicated smoothing algorithm (14) (red). Note the many breakpoints, gains, losses and amplifications in the BT474 profile and the lack of those in the male–female profile. Detailed profiles of chromosome 17 for the BT474 (C) and male–female (D) hybridizations. Log2ratios were calculated without moving average and are displayed in black as a function of their position on chromosome 17. Smoothed values of the log2ratios (red). The arrow in C indicates a fifth amplification in the BT474 profile on chromosome 17 that was not observed in a 1 Mb BAC array (3).
Figure 2
Figure 2
Performance of the oligo array CGH platform. (A) DNA from the cell line GM01750 was hybridized against normal female reference DNA. Copy number changes were detected using the smoothing algorithm (14). Blue: median values and SDs (error bars) were calculated for the areas with different copy numbers and are displayed as a function of the theoretical log2ratio. The different areas were the X-chromosome (theoretical ratio = 1/2, log2ratio = −1), chromosomes 1–8, 10–13 and 15–22 (theoretical ratio = 2/2, log2ratio = 0) and the gain in chromosome 9 (theoretical ratio = 3/2, log2ratio = 0.58). The correlation coefficient is 0.98 and the slope is 0.38. Red: same values calculated after applying a moving average of 3 to the data. Note that the red error bars do not overlap. (B) Detailed profile of chromosome 9 of the GM01750 hybridization. Log2ratios were calculated without moving average and are displayed in black as a function of their position on chromosome 9. Smoothed values of the log2ratios (red).
Figure 3
Figure 3
Reproducibility of the oligo array CGH platform. BT474 DNA was hybridized four times against normal human male reference DNA on four different days and on three different batches of 29 K human oligo arrays. Log2ratios were calculated without moving average and are displayed in different colours as indicated for each experiment as a function of their position on chromosome 2.
Figure 4
Figure 4
Detection of a homozygous deletion by the oligo array CGH platform. DNA from the cell lines MDA-MB-468 (A) and SUM159 (C) was hybridized with normal male reference DNA on a human oligo array. Log2ratios were calculated without moving average and are displayed in black as a function of their position on chromosome 13. The smoothed values of the log2ratios are displayed in red and the position of the RB1 oligo is indicated by the green circle in A and the arrow in C. Note the lack of the deletion in SUM159. Validation of the HD by FISH analysis in cell lines: MDA-MB-468 (B) and SUM159 (D). The green signal from the RB1 probe clearly shows the presence of RB1 in SUM159 (D), but is absent from MDA-MB-468 (B). Chromosome 13 paint (red) shows the presence of three normal copies of chromosome 13 and two marker chromosomes with chromosome 13 material.
Figure 5
Figure 5
Detection of a heterozygous deletion by the oligo array CGH platform. (A) DNA from the cell line SKBR7 was hybridized with normal male reference DNA on a human oligo array. Log2ratios were calculated without moving average and are displayed in black as a function of their position on chromosome 12. The smoothed values of the log2ratios are displayed in red. (B) Validation of the heterozygous deletion on 12q24 by FISH analysis of cell line SKBR7. Chromosome 12 paint (dark blue) shows two copies of seemingly normal chromosome 12. FISH using 3 BACs, RP11-340F14 (red), RP11-44F24 (green) and RP11-7M8 (aqua blue) confirmed the interstitial deletion on one copy of chromosome 12 (arrow). Overlapping FISH signals from different BACs show up in white.
Figure 6
Figure 6
Validation of the oligo array CGH platform with DNA obtained from FFPE tissue. DNA from an FFPE gastric tumour was hybridized with normal human reference DNA on a human oligo array (A) and a 1 Mb human BAC array (B). Log2ratios were calculated without moving average and are displayed for chromosomes 19–21 as a function of their position on the genome. Log2ratios of the odd and even chromosomes are shown in aqua blue and black, respectively. Chromosome numbers are indicated. Smoothed values of the log2ratios (red).
Figure 7
Figure 7
Validation of the mouse oligo array CGH platform. DNA from a mouse tumour was hybridized with normal mouse reference DNA on a 21 K mouse oligo array (A). Log2ratios were calculated with a weighted moving average as described (11) using a window of 250 kb and are displayed as a function of their position in the genome. The same mouse tumour and reference DNA was hybridized in a paired fluor-reversed experiment (dye-swap) to a 1 Mb mouse BAC array (B). Log2ratios were calculated as described (15) and displayed as a function of their position in the genome. Log2ratios of the odd and even chromosomes are shown in aqua blue and black, respectively. Smoothed values of the log2ratios (red).

References

    1. Pinkel D., Segraves R., Sudar D., Clark S., Poole I., Kowbel D., Collins C., Kuo W.L., Chen C., Zhai Y., et al. High resolution analysis of DNA copy number variation using comparative genomic hybridization to microarrays. Nature Genet. 1998;20:207–211. - PubMed
    1. Oostlander A.E., Meijer G.A., Ylstra B. Microarray-based comparative genomic hybridization and its applications in human genetics. Clin. Genet. 2004;66:488–495. - PubMed
    1. Snijders A.M., Nowak N., Segraves R., Blackwood S., Brown N., Conroy J., Hamilton G., Hindle A.K., Huey B., Kimura K., et al. Assembly of microarrays for genome-wide measurement of DNA copy number. Nature Genet. 2001;29:263–264. - PubMed
    1. Kallioniemi A., Kallioniemi O.P., Sudar D., Rutovitz D., Gray J.W., Waldman F., Pinkel D. Comparative genomic hybridization for molecular cytogenetic analysis of solid tumors. Science. 1992;258:818–821. - PubMed
    1. Ishkanian A.S., Malloff C.A., Watson S.K., DeLeeuw R.J., Chi B., Coe B.P., Snijders A., Albertson D.G., Pinkel D., Marra M.A., et al. A tiling resolution DNA microarray with complete coverage of the human genome. Nature Genet. 2004;36:299–303. - PubMed

Publication types