

Identification of a glyphosate-resistant mutant of rice 5-enolpyruvylshikimate 3-phosphate synthase using a directed evolution strategy
- PMID: 16361526
- PMCID: PMC1326043
- DOI: 10.1104/pp.105.068577
Identification of a glyphosate-resistant mutant of rice 5-enolpyruvylshikimate 3-phosphate synthase using a directed evolution strategy
Abstract
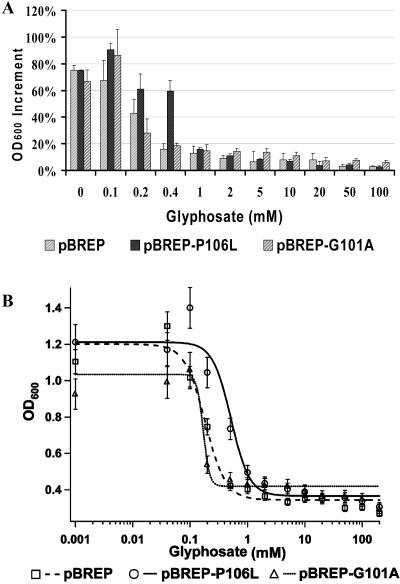
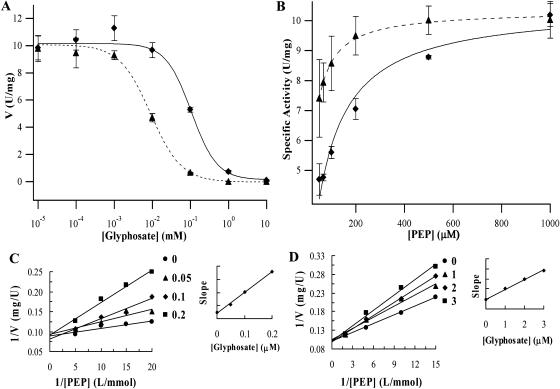
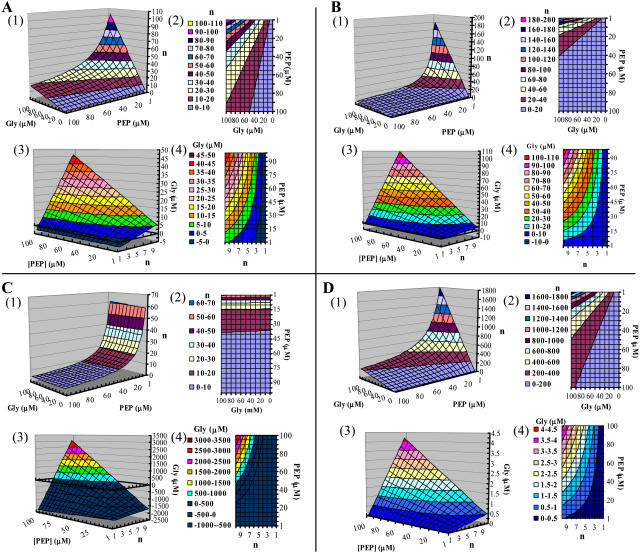
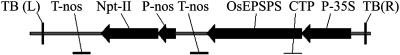
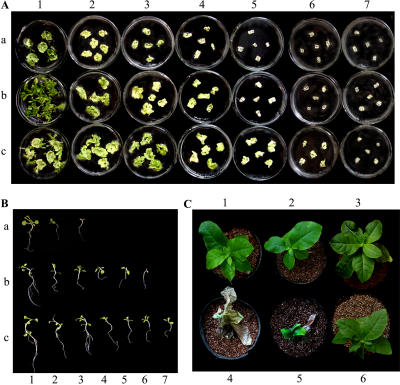
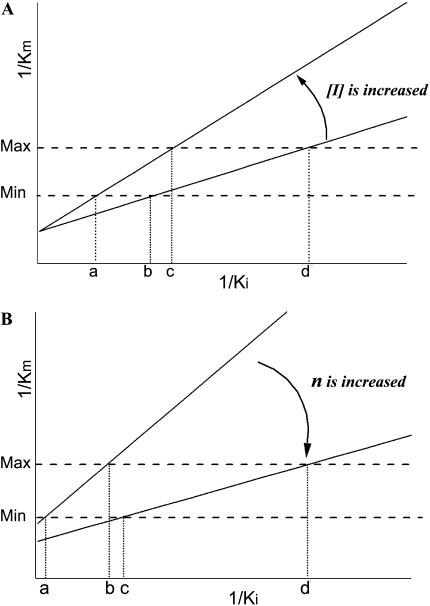
5-enolpyruvylshikimate 3-phosphate synthase (EPSPS) is a key enzyme in the shikimate pathway and is targeted by the wide-spectrum herbicide glyphosate. Here, we describe the use of a selection system based on directed evolution to select glyphosate-resistant mutants of EPSPS. Using this system, the rice (Oryza sativa) EPSPS gene, mutagenized by Error-Prone polymerase chain reaction, was introduced into an EPSPS-deficient Escherichia coli strain, AB2829, and transformants were selected on minimal medium by functional complementation. Three mutants with high glyphosate resistance were identified in three independent glyphosate selection experiments. Each mutant contained a C(317)-->T transition within the EPSPS coding sequence, causing a change of proline-106 to leucine (P106L) in the protein sequence. Glyphosate resistance assays indicated a 3-fold increase in glyphosate resistance of E. coli expressing the P106L mutant. Affinity of the P106L mutant for glyphosate and phosphoenolpyruvate was decreased about 70-fold and 4.6-fold, respectively, compared to wild-type EPSPS. Analysis based on a kinetic model demonstrates that the P106L mutant has a high glyphosate resistance while retaining relatively high catalytic efficiency at low phosphoenolpyruvate concentrations. A mathematical model derived from the Michaelis-Menten equation was used to characterize the effect of expression level and selection conditions on kinetic (Ki and Km) variation of the mutants. This prediction suggests that the expression level is an important aspect of the selection system. Furthermore, glyphosate resistance of the P106L mutant was confirmed in transgenic tobacco (Nicotiana tabacum), demonstrating the potential for using the P106L mutant in transgenic crops.
Figures
Similar articles
-
Improvement of Glyphosate Resistance through Concurrent Mutations in Three Amino Acids of the Pantoea sp. 5-Enolpyruvylshikimate-3-Phosphate Synthase.J Microbiol Biotechnol. 2018 Aug 28;28(8):1384-1390. doi: 10.4014/jmb.1801.01026. J Microbiol Biotechnol. 2018. PMID: 29996624
-
Expression of a bacterial aroA mutant, aroA-M1, encoding 5-enolpyruvylshikimate-3-phosphate synthase for the production of glyphosate-resistant tobacco plants.J Plant Res. 2003 Dec;116(6):455-60. doi: 10.1007/s10265-003-0120-8. Epub 2003 Sep 4. J Plant Res. 2003. PMID: 12955571
-
Transgenic tobacco simultaneously overexpressing glyphosate N-acetyltransferase and 5-enolpyruvylshikimate-3-phosphate synthase are more resistant to glyphosate than those containing one gene.Transgenic Res. 2015 Aug;24(4):753-63. doi: 10.1007/s11248-015-9874-8. Epub 2015 Mar 31. Transgenic Res. 2015. PMID: 25822532
-
Expression of CP4 EPSPS in microspores and tapetum cells of cotton (Gossypium hirsutum) is critical for male reproductive development in response to late-stage glyphosate applications.Plant Biotechnol J. 2006 Sep;4(5):477-87. doi: 10.1111/j.1467-7652.2006.00203.x. Plant Biotechnol J. 2006. PMID: 17309724 Review.
-
Glyphosate Resistance and EPSPS Gene Duplication: Convergent Evolution in Multiple Plant Species.J Hered. 2018 Feb 14;109(2):117-125. doi: 10.1093/jhered/esx087. J Hered. 2018. PMID: 29040588 Review.
Cited by
-
Identification of a new gene encoding 5-enolpyruvylshikimate-3-phosphate synthase using genomic library construction strategy.Mol Biol Rep. 2012 Dec;39(12):10939-47. doi: 10.1007/s11033-012-1994-0. Epub 2012 Oct 23. Mol Biol Rep. 2012. PMID: 23090479
-
Transgenic Cotton (Gossypium hirsutum L.) to Combat Weed Vagaries: Utility of an Apical Meristem-Targeted in planta Transformation Strategy to Introgress a Modified CP4-EPSPS Gene for Glyphosate Tolerance.Front Plant Sci. 2020 Jul 7;11:768. doi: 10.3389/fpls.2020.00768. eCollection 2020. Front Plant Sci. 2020. PMID: 32733492 Free PMC article.
-
Isolation and functional characterization of 5-enolpyruvylshikimate 3-phosphate synthase gene from glyphosate-tolerant Pseudomonas nitroreducens strains FY43 and FY47.3 Biotech. 2020 Apr;10(4):183. doi: 10.1007/s13205-020-02176-7. Epub 2020 Mar 28. 3 Biotech. 2020. PMID: 32257739 Free PMC article.
-
A thermostable β-glucuronidase obtained by directed evolution as a reporter gene in transgenic plants.PLoS One. 2011;6(11):e26773. doi: 10.1371/journal.pone.0026773. Epub 2011 Nov 9. PLoS One. 2011. PMID: 22096498 Free PMC article.
-
Development of Novel Glyphosate-Tolerant Japonica Rice Lines: A Step Toward Commercial Release.Front Plant Sci. 2016 Aug 30;7:1218. doi: 10.3389/fpls.2016.01218. eCollection 2016. Front Plant Sci. 2016. PMID: 27625652 Free PMC article.
References
-
- Amrhein N, Johanning D, Schab J, Schulz A (1983) Biochemical basis for glyphosate-tolerance in a bacterium and a plant tissue culture. FEBS Lett 157: 191–196
-
- Arnold FH, Wintrode PL, Miyazaki K, Gershenson A (2001) How enzymes adapt: lessons from directed evolution. Trends Biochem Sci 26: 100–106 - PubMed
-
- Barry G, Kishore G, Padgette SR, Taylor ML, Kolacz K, Weldon M, Re DB, Eichholtz DA, Fincher K, Hallas L (1992) Inhibitors of amino acid biosynthesis: strategies for imparting glyphosate tolerance to crop plants. In BK Singh, HE Flores, JC Shannon, eds, Biosynthesis and Molecular Regulation of Amino Acids in Plants. American Society of Plant Physiologists, Madison, WI, pp 139–145
Publication types
MeSH terms
Substances
Associated data
- Actions
LinkOut - more resources
Full Text Sources
Other Literature Sources
