. 2006 Jan 11;25(1):163-73.
doi: 10.1038/sj.emboj.7600918. Epub 2005 Dec 15.

Molecular basis of RNA recognition by the human alternative splicing factor Fox-1

Affiliations

Molecular basis of RNA recognition by the human alternative splicing factor Fox-1

Sigrid D Auweter et al. EMBO J. .

Abstract

The Fox-1 protein regulates alternative splicing of tissue-specific exons by binding to GCAUG elements. Here, we report the solution structure of the Fox-1 RNA binding domain (RBD) in complex with UGCAUGU. The last three nucleotides, UGU, are recognized in a canonical way by the four-stranded beta-sheet of the RBD. In contrast, the first four nucleotides, UGCA, are bound by two loops of the protein in an unprecedented manner. Nucleotides U1, G2, and C3 are wrapped around a single phenylalanine, while G2 and A4 form a base-pair. This novel RNA binding site is independent from the beta-sheet binding interface. Surface plasmon resonance analyses were used to quantify the energetic contributions of electrostatic and hydrogen bond interactions to complex formation and support our structural findings. These results demonstrate the unusual molecular mechanism of sequence-specific RNA recognition by Fox-1, which is exceptional in its high affinity for a defined but short sequence element.


Figures

Figure 1
Figure 1
UGCAUGU binds to the RBD of Fox-1 and affects residues in the β-sheet and in loops. (A) 15N-labeled HSQC spectra of ∼1 mM solutions of the free RBD of Fox-1 (blue) and of the RBD of Fox-1 in the presence of one equivalent of 5′-UGCAUGU-3′ (red) at 313 K. (B) Sections of 2D TOCSY spectra showing the H5–H6 correlations of uracil and cytosine of ∼1 mM solutions of free 5′-UGCAUGU-3′ (blue) and of 5′-UGCAUGU-3′ in the presence of one equivalent of protein (red). (C) The changes in chemical shift of the backbone amide nitrogen (black) and proton (grey) between free and bound Fox-1 (in Hz, on a 600 MHz spectrometer) are plotted versus the amino-acid residue number. Large chemical shift changes occur in the β-strands as well as in loops β1α1 and β2β3 (assignments for residues 125, 126, 131, 152 and after 191 could not be obtained for the free protein).
Figure 2
Figure 2
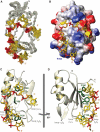
Overview of the solution structure of the RBD of Fox-1 in complex with UGCAUGU. (A) Overlay of the final 30 structures superposed on the heavy atoms of the structured parts of the protein and of the RNA. The protein backbone is gray, the RNA backbone is orange, the phosphate groups are red, and the RNA bases are yellow. Only the ordered region of the protein (residues 116–194) is shown. (B) Surface (heavy atoms of residues 116–194) and stick (heavy atoms of the RNA) representation of the lowest energy structure. The protein surface is painted according to surface potential with red indicating negative charges and blue indicating positive charges. The RNA is colored as in panel (A). (C) The lowest energy structure in ribbon (protein backbone) and stick (RNA) representation. The color scheme is the same as in (A), important protein side chains involved in hydrophobic interactions with the RNA are represented as green sticks. (D) Same as (C) but rotated by 90° around the indicated axis. Figures were generated with MOLMOL (Koradi et al, 1996).
Figure 3
Figure 3
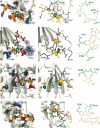
Molecular recognition of UGCAUGU by the RBD of Fox-1. Close-up views of the RNA binding interface of the overlay of the final 30 structures superposed on the heavy atoms of the structured parts of the protein and of the RNA (left), single structures showing the intermolecular and intra-RNA interactions that are most commonly observed in the 30 structures (middle; see Supplementary Table SI) and schematic representations of the hydrogen bonding interactions that are most commonly observed in the 30 structures (right). The ribbon representation of the protein backbone is shown in grey, side chains of the protein are in green and the RNA is in yellow. Recognition of U1 and C3 (A), of G2 and A4 (B), of U5 (C), and of G6 and U7 (D). Figures were generated with MOLMOL (Koradi et al, 1996).
Figure 4
Figure 4
Salt dependence of RNA binding examined by surface plasmon resonance measurements. (A) Representative curves for binding of the RBD of Fox-1 to an immobilized oligonucleotide biotin-5′-CUCUGCAUGU-3′ at different salt concentrations. At 75, 150, 300 and 500 mM NaCl, binding curves for 20, 10, 5, 2.5, 1.25, 0.625, 0.312 and 0.156 nM protein, 20, 10, 5, 2.5, 1.25, 0.625 and 0.312 nM protein, 80, 40, 20, 10, 5, 2.5 and 1.25 nM protein, and 320, 160, 80, 40, 20, 10, 5 and 2.5 nM protein are shown, respectively. Curves are fit according to a 1:1 Langmuir interaction model including a correction term for mass transport limitations and are shown as grey lines. (B) Plot of log KD (•), log koff (○) and log kon (▴) versus log f±. f± is the electrostatic contribution to the mean rational activity coefficient, which is linked to the ionic strength, see Materials and methods section and Supplementary Table SII. Each data point represents the average of at least three independent measurements.
Figure 5
Figure 5
F126 plays a crucial role in RNA binding. (A) Affinities of single amino-acid mutants of Fox-1. Values for KDs are derived from steady state binding levels at different protein concentrations using surface plasmon resonance. Each measurement was repeated three times at 150 mM NaCl and pH 7.4. (B) Overlay of sections of 2D TOCSY spectra showing the H5–H6 correlations of uracil and cytosine of ∼1 mM solutions of 5′-UGCAUGU-3′ in the presence of one equivalent of Fox-1 (red), Fox-1 F126A (black), and Fox-1 F160A (cyan). (C) Sections of 2D NOESY spectra of a 1:1 complex of Fox-1 (red) or Fox-1 F126A (black) with UGCAUGU showing NOE crosspeaks to the imino protons of G6, G2 and U5.

References

    1. Allain F, Bouvet P, Dieckmann T, Feigon J (2000) Molecular basis of sequence-specific recognition of pre-ribosomal RNA by nucleolin. EMBO J 19: 6870–6881 - PMC - PubMed
    1. Baerga-Ortiz A, Bergqvist S, Mandell J, Komives E (2004) Two different proteins that compete for binding to thrombin have opposite kinetic and thermodynamic profiles. Protein Sci 13: 166–176 - PMC - PubMed
    1. Baraniak A, Lasda E, Wagner E, Garcia-Blanco M (2003) A stem structure in fibroblast growth factor receptor 2 transcripts mediates cell-type-specific splicing by approximating intronic control elements. Mol Cell Biol 23: 9327–9337 - PMC - PubMed
    1. Baur M, Gemmecker G, Kessler H (1998) C-13-NOESY-HSQC with split carbon evolution for increased resolution with uniformly labeled proteins. J Magn Reson 132: 191–196 - PubMed
    1. Bax A, Clore G, Gronenborn A (1990) H-1-H-1 correlation via isotropic mixing of C-13 magentization, a new 3-domensional approach for assigning H-1 and C-13 spectra of C-13 enriched peoteins. J Magn Reson 88: 425–431

Publication types