. 2005 Dec;1(4):e41.
doi: 10.1371/journal.ppat.0010041. Epub 2005 Dec 16.

Recognition of conserved amino acid motifs of common viruses and its role in autoimmunity

Affiliations

Recognition of conserved amino acid motifs of common viruses and its role in autoimmunity

Mireia Sospedra et al. PLoS Pathog. 2005 Dec.

Abstract

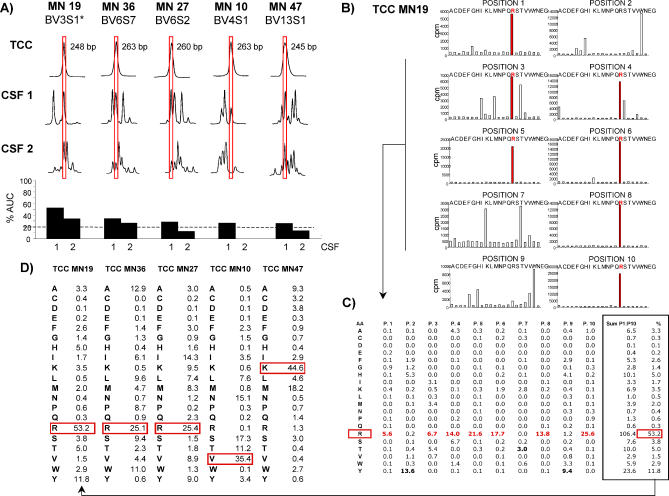
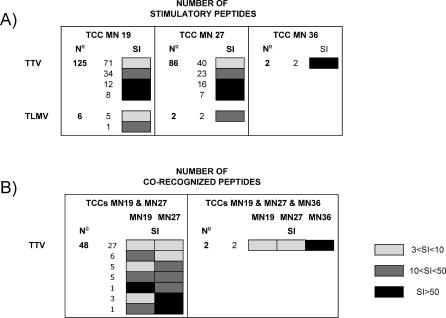
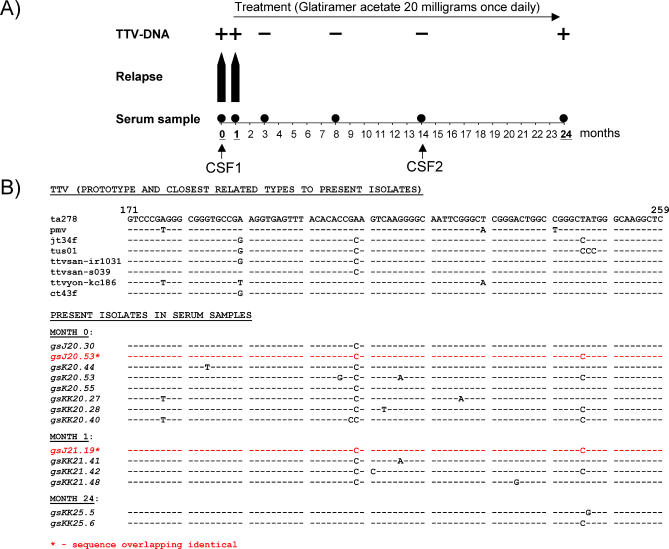
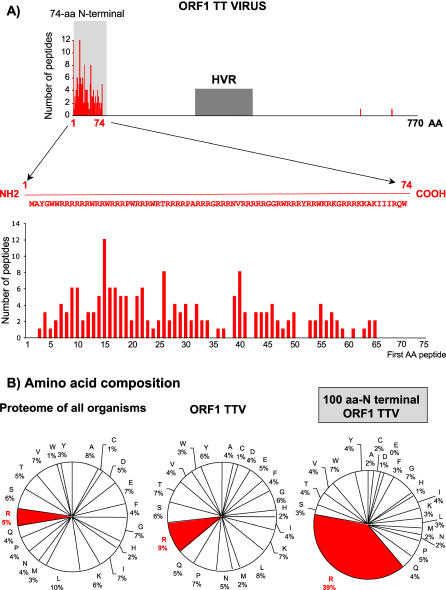
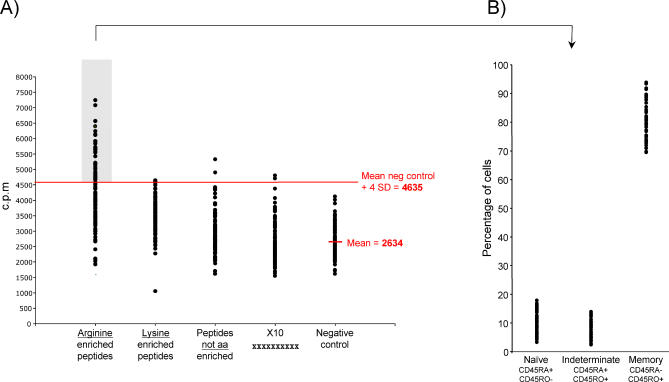
The triggers of autoimmune diseases such as multiple sclerosis (MS) remain elusive. Epidemiological studies suggest that common pathogens can exacerbate and also induce MS, but it has been difficult to pinpoint individual organisms. Here we demonstrate that in vivo clonally expanded CD4+ T cells isolated from the cerebrospinal fluid of a MS patient during disease exacerbation respond to a poly-arginine motif of the nonpathogenic and ubiquitous Torque Teno virus. These T cell clones also can be stimulated by arginine-enriched protein domains from other common viruses and recognize multiple autoantigens. Our data suggest that repeated infections with common pathogenic and even nonpathogenic viruses could expand T cells specific for conserved protein domains that are able to cross-react with tissue-derived and ubiquitous autoantigens.


Conflict of interest statement

Competing interests. The authors have declared that no competing interests exist.

Figures

Figure 1
Figure 1. In Vivo-Expanded CSF-Infiltrating TCCs and Their Response to PS-SCL
(A) TCR BV rearrangement (*Arden's nomenclature) of selected TCCs. Histograms of the relative CDR3 length distributions of each TCC (top histogram) and CSF T cells (middle and bottom histograms). Fluorescence intensity is listed on the y-axis, and on the x-axis, the electrophoresis time resolving in-frame rearrangements of TCRB CDR3 at 3-nt intervals. Red boxes identify the correct alignment. The bottom graph represents the percent contribution (expressed as AUC) of the TCCs' CDR3 to all CDR3s with the same BV chain in the CSF samples. (B) Proliferative response of MN19 to a complete decapeptide PS-SCL. Single-letter aa codes are listed on the x-axes, and proliferation (cpm) is shown on the y-axis. Data represent one experiment of three. The mixtures with R as the defined aa inducing the highest response are shown in red. (C) Score matrix for MN19. Each number represents the SIPS-SCL (mean of three independent experiments) of each of the 200 mixtures of a decapeptide PS-SCL (rows, aa; columns, positions). The last column represents the optimal composition of stimulatory peptides “peptidome.” The aa contributing the most to “peptidome” is shown in red. (D) Peptidomes of the five in vivo-expanded TCCs.
Figure 2
Figure 2. Stimulatory Peptides from TTV and TLMV
(A) Number and SIs of the stimulatory peptides from TTV and TLMV identified for TCCs MN19, MN27, and MN36. (B) Number and SIs of the peptides co-recognized by different TCCs. Peptides have been tested in proliferation assays at 10 μg/ml and using PBMCs as antigen-presenting cells.
Figure 3
Figure 3. TTV-DNA in Patient's Serum Samples
(A) Detection of TTV-DNA by PCR amplification using two primer combinations with the respective nested primers. Six different serum samples from the same patient obtained at different time points were analyzed. The first two samples were obtained during relapse. Time points with simultaneous CSF are indicated. Plus symbol indicates presence of TTV DNA; minus symbol indicates absence. (B) The sequences obtained by cloning and sequencing of all amplicons and the alignment with the closer related known TT viruses are shown. One isolate that was present in two different serum samples is shown in red.
Figure 4
Figure 4. Characterization TTV Peptides
(A) Configuration of ORF1 from TTV showing the hypervariable region (HVR) and the 74-aa N-terminal domain. Sequence of the first 74 aa for a prototype TTV is shown. Distribution of all TTV stimulatory peptides identified between the first 74 aa is shown. (B) AA composition of all proteins, ORF1 from TTV, and the 74-aa N-terminal region of ORF1.
Figure 5
Figure 5. TCL Response to R-Enriched Peptides in Peripheral Blood
(A) Proliferative response of peripheral TCL to the following: a mixture of ten peptides enriched in R, a mixture of ten peptides enriched in K, a mixture of ten peptides not enriched in any specific aa, and a mixture of randomized decapeptides. Negative control is medium without peptide mixture. Responses higher that the mean of the negative control plus 4 standard deviations have been considered positive. * Detailed information of mixtures used in IL-7 primary proliferation assay are available in Table S3. (B) Comparison of the origin (naïve versus memory) of all TCLs with confirmed reactivity against R-enriched peptides.

Similar articles

Cited by

References

    1. Sibley WA, Bamford CR, Clark K. Clinical viral infections and multiple sclerosis. Lancet. 1985;1:1313–1315. - PMC - PubMed
    1. Johnson RT. The virology of demyelinating diseases. Ann Neurol. 1994;36((Suppl)):S54–60. - PMC - PubMed
    1. Soldan SS, Jacobson S. Role of viruses in etiology and pathogenesis of multiple sclerosis. Adv Virus Res. 2001;56:517–555. - PMC - PubMed
    1. Fujinami RS, Oldstone MB. Amino acid homology between the encephalitogenic site of myelin basic protein and virus: Mechanism for autoimmunity. Science. 1985;230:1043–1045. - PubMed
    1. Wucherpfennig KW, Strominger JL. Molecular mimicry in T cell-mediated autoimmunity: Viral peptides activate human T cell clones specific for myelin basic protein. Cell. 1995;80:695–705. - PMC - PubMed

Publication types

MeSH terms

Associated data