Comparative Study
. 2006 Mar-Apr;8(2):139-48.
doi: 10.1007/s10126-005-5042-0. Epub 2006 Jan 1.

Characterization of muscle-regulatory gene, MyoD, from flounder (Paralichthys olivaceus) and analysis of its expression patterns during embryogenesis

Affiliations
Comparative Study

Characterization of muscle-regulatory gene, MyoD, from flounder (Paralichthys olivaceus) and analysis of its expression patterns during embryogenesis

Yuqing Zhang et al. Mar Biotechnol (NY). 2006 Mar-Apr.

Abstract

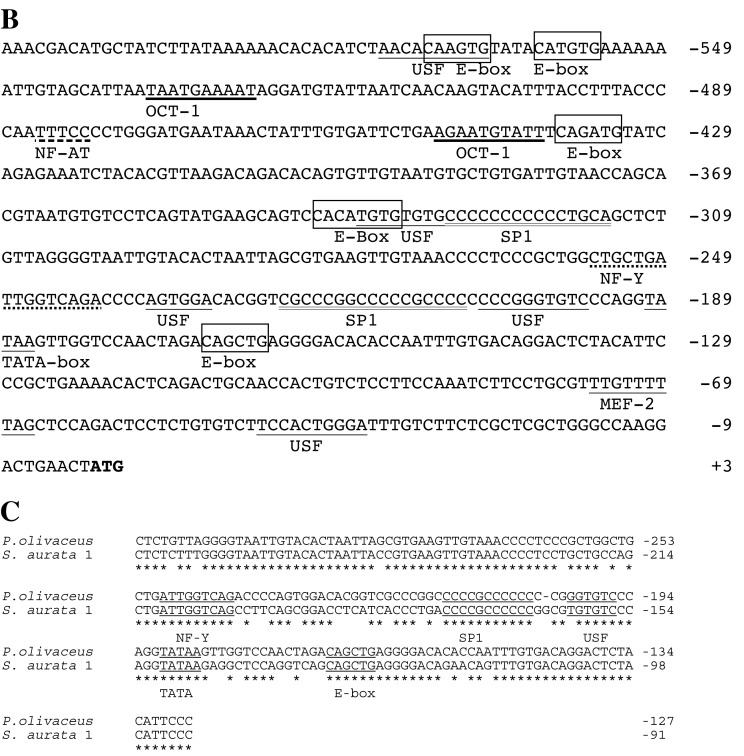
Specification and differentiation of skeletal muscle cells are driven by the activity of genes encoding members of the myogenic regulatory factors (MRFs). In vertebrates, the MRF family includes MyoD, Myf5, myogenin, and MRF4. The MRFs are capable of converting a variety of nonmuscle cells into myoblasts and myotubes. To better understand their roles in fish muscle development, we isolated the MyoD gene from flounder (Paralichthys olivaceus) and analyzed its structure and patterns of expression. Sequence analysis showed that flounder MyoD shared a structure similar to that of vertebrate MRFs with three exons and two introns, and its protein contained a highly conserved basic helix-loop-helix domain (bHLH). Comparison of sequences revealed that flounder MyoD was highly conserved with other fish MyoD genes. Sequence alignment and phylogenetic analysis indicated that flounder MyoD, seabream (Sparus aurata) MyoD1, takifugu (Takifugu rubripes) MyoD, and tilapia (Oreochromis aureus) MyoD were more likely to be homologous genes. Flounder MyoD expression was first detected as two rows of presomitic cells in the segmental plate. From somitogenesis, MyoD transcripts were present in the adaxial cells that give rise to slow muscles and the lateral somitic cells that give rise to fast muscles. After 30 somites formed, MyoD expression decreased in the somites except the caudal somites, coincident with somite maturation. In the hatching stage, MyoD was expressed in other muscle cells and caudal somites. It was detected only in muscle in the growing fish.


Figures

Fig. 1
Fig. 1
(A) Comparison of deduced amino acid sequences of flounder MyoD with those of other vertebrate. The highly conserved basic helix-loop-helix domains are underlined, and the basic region is indicated by shading. *Represents identical amino acid. The GenBank accession numbers for these fish MyoD genes are: flounder MyoD (Paralichthys olivaceus, XXXXXX); seabream MyoD1 (Sparus aurata, AF478568); seabream MyoD2 (Sparus aurata, AF478569); tilapia MyoD (Oreochromis aureus, AF270790); trout MyoD1 (Oncorhynchus mykiss, X75798); trout MyoD2 (Oncorhynchus mykiss, Z46924); takifugu MyoD (Takifugu rubripes, T007049); zebrafish MyoD (Danio rerio, AF318503); carp MyoD (Cyprinus carpio, AB012882). (B) Putative muscle specific transcription factor binding sites in the 0.6-kb promoter region of flounder MyoD gene. Numbers indicated the nucleotide position relative to the translation start code (ATG). (C) The identification of conserved region in the MyoD promoters. The sequence comparison of a 187-bp highly conserved region in the promoters of flounder MyoD and seabream MyoD1 (GenBank accession no. AF AF478568) genes. Numbers indicate the nucleotide position relative to the translation start code (ATG).
Fig. 1
Fig. 1
(A) Comparison of deduced amino acid sequences of flounder MyoD with those of other vertebrate. The highly conserved basic helix-loop-helix domains are underlined, and the basic region is indicated by shading. *Represents identical amino acid. The GenBank accession numbers for these fish MyoD genes are: flounder MyoD (Paralichthys olivaceus, XXXXXX); seabream MyoD1 (Sparus aurata, AF478568); seabream MyoD2 (Sparus aurata, AF478569); tilapia MyoD (Oreochromis aureus, AF270790); trout MyoD1 (Oncorhynchus mykiss, X75798); trout MyoD2 (Oncorhynchus mykiss, Z46924); takifugu MyoD (Takifugu rubripes, T007049); zebrafish MyoD (Danio rerio, AF318503); carp MyoD (Cyprinus carpio, AB012882). (B) Putative muscle specific transcription factor binding sites in the 0.6-kb promoter region of flounder MyoD gene. Numbers indicated the nucleotide position relative to the translation start code (ATG). (C) The identification of conserved region in the MyoD promoters. The sequence comparison of a 187-bp highly conserved region in the promoters of flounder MyoD and seabream MyoD1 (GenBank accession no. AF AF478568) genes. Numbers indicate the nucleotide position relative to the translation start code (ATG).
Fig. 2
Fig. 2
Phylogenetic analysis of flounder MyoD gene sequences relative to MyoD genes of other fish species and vertebrates. The deduced protein sequences were used in the analysis using Clustal W sequence alignment program. Note flounder MyoD, sea bream MyoD1, and takifugu and tilapia MyoD are in the same branch. The tree was constructed from the set of aligned sequences shown in Figure 1, plus Drosophila MyoD (Drosophila melanogaster, M68897); Amphioxus MyoD (Branchiostoma belcheri, AY066009); Xenopus MyoD (Xenopus laevis, X16106); chicken MyoD (Gallus gallus, X16189); quail MyoD (Coturnix coturnix, L16686); sheep MyoD (Ovis aries, X62102); pig MyoD (Sus scrofa, U12574); mouse MyoD (Mus musculus, NM-010866); human MyoD (Homo sapiens, NM-002478).
Fig. 3
Fig. 3
Temporal and spatial expression of MyoD in flounder embryos. (AE) Anterior is to the left and dorsal view. (A) Stage 1 embryo (completion of epiboly, before somite formation). MyoD labeling was present in two cords of cells (arrowhead) adjacent to the prospective notochord. (B) Stage 2 embryo (3 somites). MyoD expression was detected in the somitic medial cells and the presomitic cells in the segmental plate. (C) Stage 3 embryo (5 somites). MyoD expression remained to the adaxial cells of the somites (arrowhead) and weak expression was also detected in the lateral somitic cells (arrow). (D) Stage 4 (7 somites): lateral expansion of MyoD labeling was observed within the somites (arrow). (E) Stage 5 (15 somites). MyoD transcripts were detected within the somites. (F) Stage 6 (about 25 somites). Lateral view. Anterior to the top: MyoD expression was detected in the myotome. (G) Stage 7 (30 somites). Anterior to the left. (H) Stage 10 (about 40 somites). Lateral view. Anterior to the top. MyoD expression decreased in older somites (arrow) while it was still strong in the neoformed somites (tail region) (arrowhead). (I) Magnification of positive signals in tail region of H. MyoD expression decreased in anterior somites (arrow) while it was still strong in the posterior somites (tail region) (arrowhead). (J) Hatching stage embryo. Lateral view, anterior to the left. (K) Ventral view. Magnification of MyoD expression in the adductor mandibulae (arrow) and adductor operculi (arrowhead). yolk removed. (L) Side view. Magnification of MyoD expression in extraocular muscle (arrow). (M) Side view. Magnification of MyoD expression in dorsal anterior myotome muscle cells (arrowhead). (N) Side view. Magnification of MyoD expression in dorsal/ventral (weak) posterior myotome muscle cells (arrowhead) and caudal somites (arrow).
Fig. 3
Fig. 3
Temporal and spatial expression of MyoD in flounder embryos. (AE) Anterior is to the left and dorsal view. (A) Stage 1 embryo (completion of epiboly, before somite formation). MyoD labeling was present in two cords of cells (arrowhead) adjacent to the prospective notochord. (B) Stage 2 embryo (3 somites). MyoD expression was detected in the somitic medial cells and the presomitic cells in the segmental plate. (C) Stage 3 embryo (5 somites). MyoD expression remained to the adaxial cells of the somites (arrowhead) and weak expression was also detected in the lateral somitic cells (arrow). (D) Stage 4 (7 somites): lateral expansion of MyoD labeling was observed within the somites (arrow). (E) Stage 5 (15 somites). MyoD transcripts were detected within the somites. (F) Stage 6 (about 25 somites). Lateral view. Anterior to the top: MyoD expression was detected in the myotome. (G) Stage 7 (30 somites). Anterior to the left. (H) Stage 10 (about 40 somites). Lateral view. Anterior to the top. MyoD expression decreased in older somites (arrow) while it was still strong in the neoformed somites (tail region) (arrowhead). (I) Magnification of positive signals in tail region of H. MyoD expression decreased in anterior somites (arrow) while it was still strong in the posterior somites (tail region) (arrowhead). (J) Hatching stage embryo. Lateral view, anterior to the left. (K) Ventral view. Magnification of MyoD expression in the adductor mandibulae (arrow) and adductor operculi (arrowhead). yolk removed. (L) Side view. Magnification of MyoD expression in extraocular muscle (arrow). (M) Side view. Magnification of MyoD expression in dorsal anterior myotome muscle cells (arrowhead). (N) Side view. Magnification of MyoD expression in dorsal/ventral (weak) posterior myotome muscle cells (arrowhead) and caudal somites (arrow).
Fig. 4
Fig. 4
RT-PCR analysis of MyoD expression in different tissues of post-hatching flounder fish. 1, DNA marker; 2–9, actin RT-PCR; 10–17, MyoD RT-PCR; 2, 10, liver; 3, 11, spleen; 4, 12, head kidney; 5, 13, body kidney; 6, 14, heart; 7, 15, muscle; 8, 16, intestine; 9, 17, negative control; 18, positive control, MyoD cDNA plasmid as the PCR template.

Similar articles

Cited by

References

    1. Arnold HH, Winter B. Muscle differentiation: more complexity to the network of myogenic regulators. Curr Opin Genet Dev. 1998;8:539–544. doi: 10.1016/S0959-437X(98)80008-7. - DOI - PubMed
    1. Blackwell T, Weintraub H. Differences and similarities in DNA-binding preferences of MyoD and E2A protein complexes revealed by binding site selection. Science. 1990;250:1104–1110. - PubMed
    1. Braun T, Arnold HH. Inactivation of Myf-6 and Myf-5 genes in mice leads to alterations in skeletal muscle development. EMBO J. 1995;14:1176–1186. - PMC - PubMed
    1. Braun T, Rudnicki MA, Arnold HH, Jaenisch R. Targeted inactivation of the mouse regulatory gene Myf5 results in abnormal distal rib development and early postnatal death in homozygous mouse mutants. Cell. 1992;71:369–382. doi: 10.1016/0092-8674(92)90507-9. - DOI - PubMed
    1. Braun T, Bober E, Rudnicki MA, Jaenisch R, Arnold HH. MyoD expression marks the onset of skeletal myogenesis in homouzygous Myf5 mutant mice. Development. 1994;120:3083–3092. - PubMed

Publication types

MeSH terms

Associated data

LinkOut - more resources