. 2005 Dec 19;171(6):1001-12.
doi: 10.1083/jcb.200508072.

Expression of mutant huntingtin in glial cells contributes to neuronal excitotoxicity

Affiliations

Expression of mutant huntingtin in glial cells contributes to neuronal excitotoxicity

Ji-Yeon Shin et al. J Cell Biol. .

Erratum in

  • J Cell Biol. 2006 Mar 13;172(6):953

Abstract

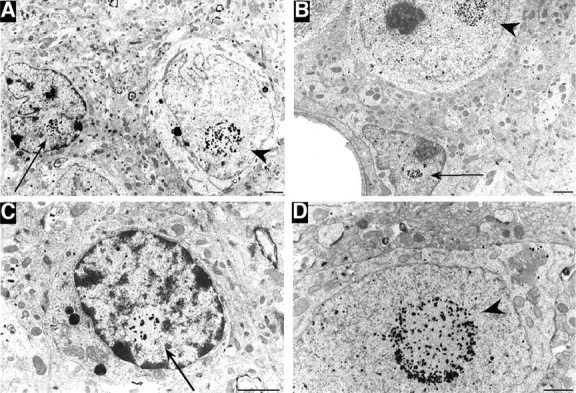
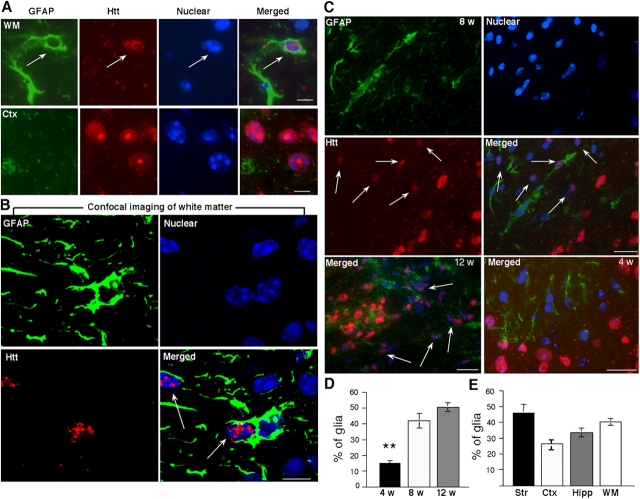
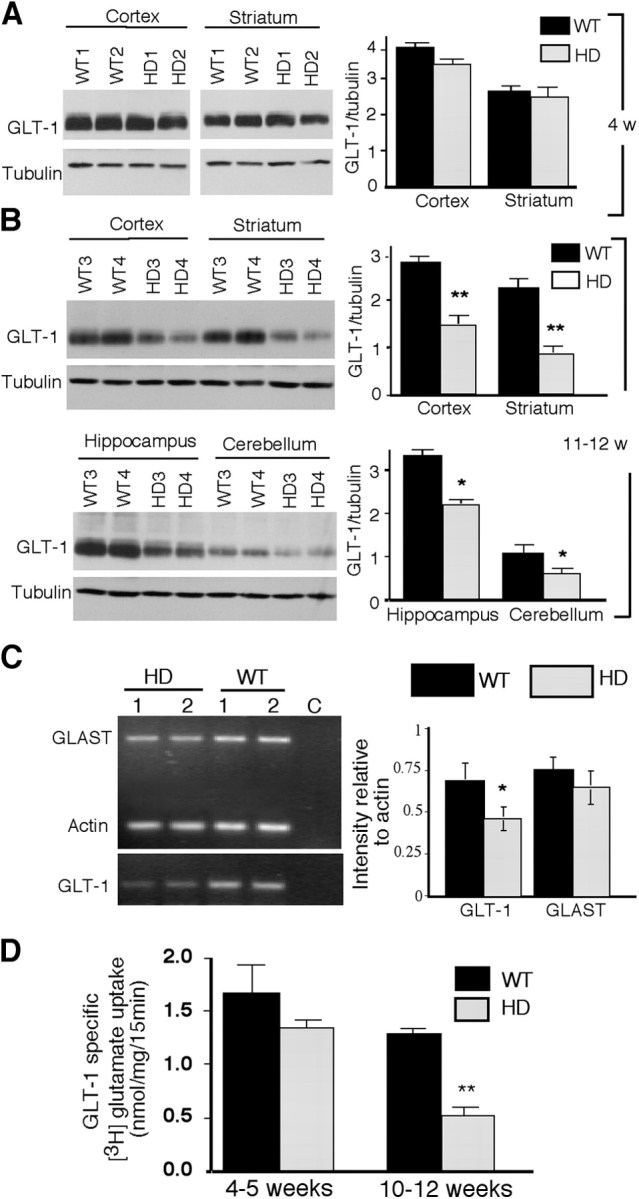
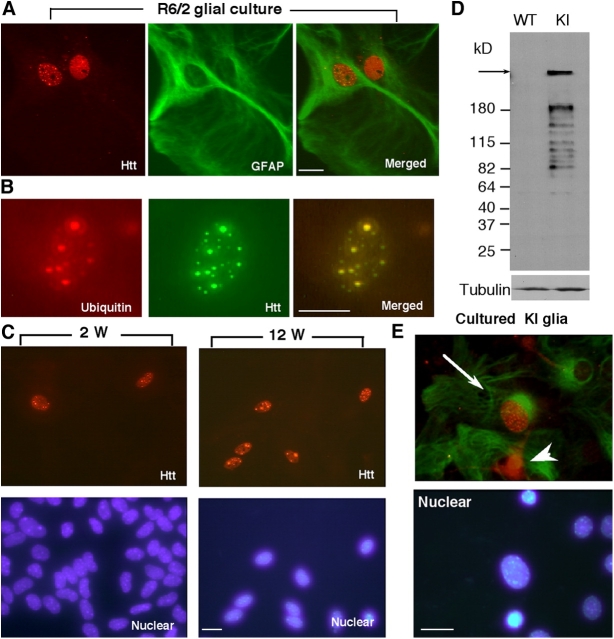
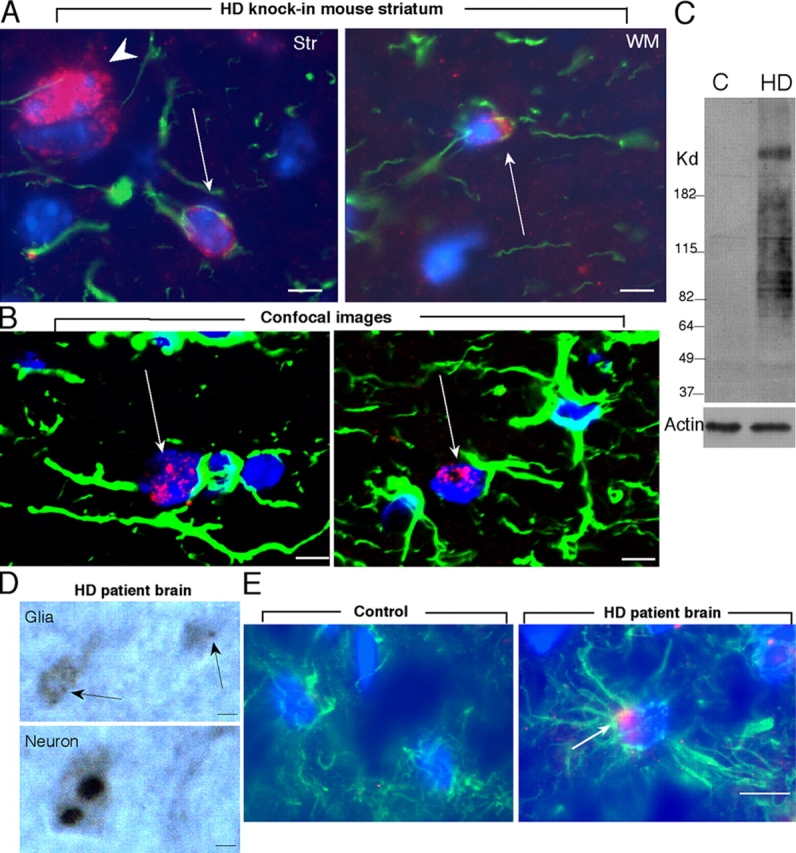
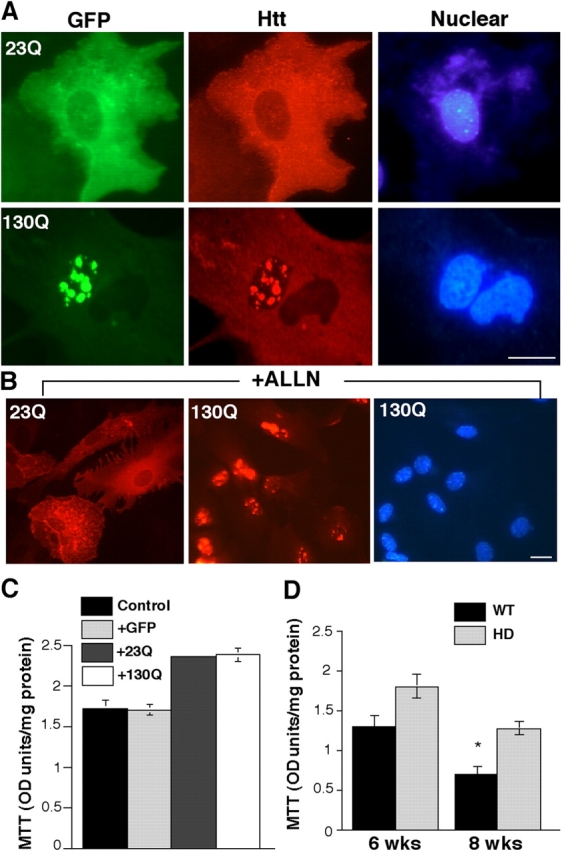
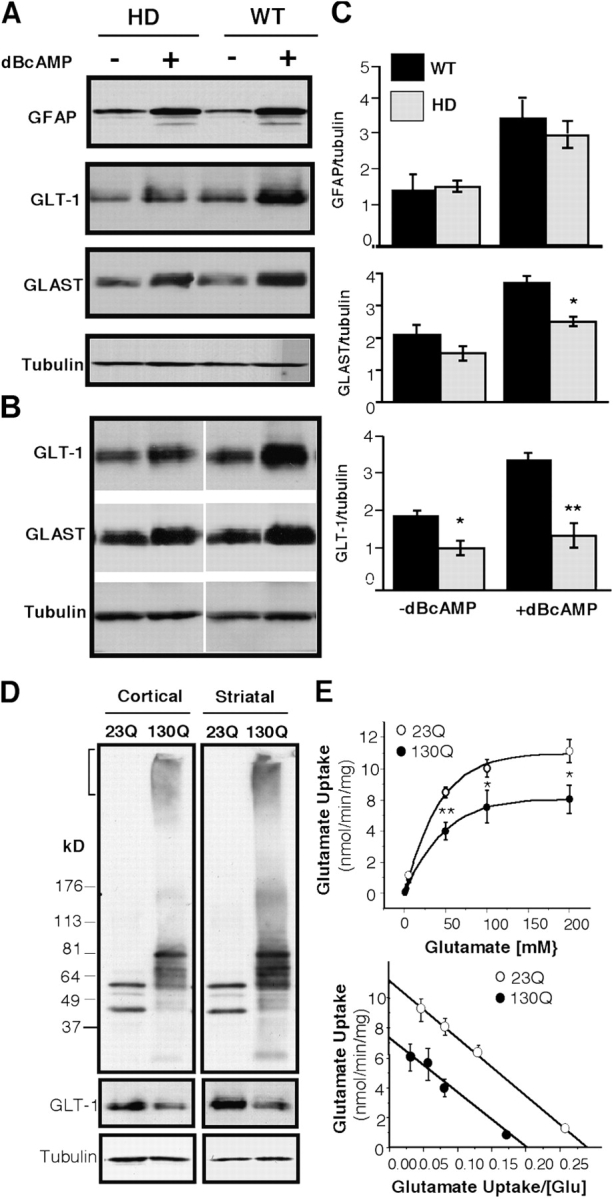
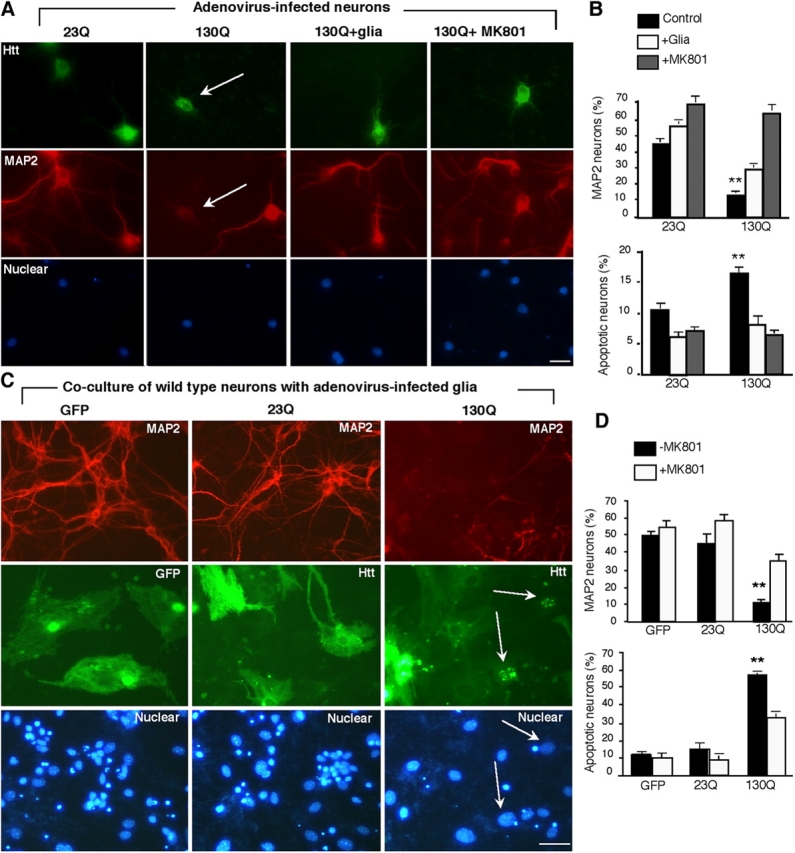
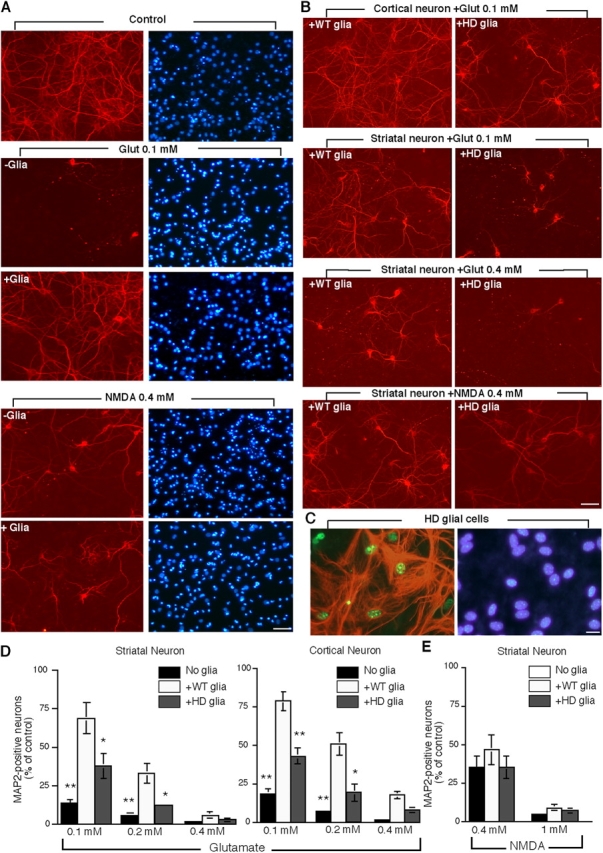
Huntington disease (HD) is characterized by the preferential loss of striatal medium-sized spiny neurons (MSNs) in the brain. Because MSNs receive abundant glutamatergic input, their vulnerability to excitotoxicity may be largely influenced by the capacity of glial cells to remove extracellular glutamate. However, little is known about the role of glia in HD neuropathology. Here, we report that mutant huntingtin accumulates in glial nuclei in HD brains and decreases the expression of glutamate transporters. As a result, mutant huntingtin (htt) reduces glutamate uptake in cultured astrocytes and HD mouse brains. In a neuron-glia coculture system, wild-type glial cells protected neurons against mutant htt-mediated neurotoxicity, whereas glial cells expressing mutant htt increased neuronal vulnerability. Mutant htt in cultured astrocytes decreased their protection of neurons against glutamate excitotoxicity. These findings suggest that decreased glutamate uptake caused by glial mutant htt may critically contribute to neuronal excitotoxicity in HD.


Figures

Figure 1.
Figure 1.
Electron micrographs of HD mouse brains. (A–D) EM48 immunogold labeling of the striatum (A) and cortex (B–D) of R6/2 mice at 12 wk of age. Immunogold-labeled aggregates are present in glial cells (arrows), which show a more condensed nuclear membrane and a smaller sized cytoplasm than do neuronal cells (arrowheads). Bars, 1 μm.
Figure 2.
Figure 2.
Immunofluorescent labeling of htt-containing glia in R6/2 transgenic mouse brains. (A) Immunofluorescent labeling of brain sections containing white matter (WM) and the central region of the cerebellar cortex (Ctx) in an R6/2 mouse 8 wk old. Mouse antibody to GFAP labeled astrocytes (green) and rabbit EM48 labeled mutant htt (red). The nuclei were labeled with Hoechst dye (blue). (B) Confocal imaging of white matter showing that the nuclei of GFAP-positive glial cells contain htt aggregates (Video 1, available at http://www.jcb.org/cgi/content/full/jcb.200508072/DC1). (C) The striatal section of an R6/2 mouse at 8 wk of age was stained with antibody to GFAP and the nuclear dye Hoechst (top). EM48 immunostaining for htt and merged image are also presented (middle). Bottom panels shows merged images of striatal regions from 12- or 4-wk old R6/2 mice. Arrows indicate glial nuclei that contain EM48 staining. Small puncta represent neuropil aggregates. (D) The percentage of glial cells containing nuclear EM48 staining in the brain striatal sections of R6/2 mice at the age of 4, 8, or 12 wk. (E) The percentage of glial cells with intranuclear htt in the striatum (Str), cortex (Ctx), hippocampus (Hipp), and WM in R6/2 mice at the age of 8–10 wk. The data (mean ± SD) were obtained from three to five mice per group. **, P < 0.01 compared with the samples of 8 or 12 wk old R6/2 mice. Bars: (A) 5 μm; (B) 2.5 μm; (C)10 μm.
Figure 3.
Figure 3.
Decreased expression of glutamate transporter GLT-1 and glutamate uptake in HD mouse brain. (A and B) Western blot analysis of the expression of GLT-1 in brain regions of wild-type (W1-W4) or R6/2 (HD1-HD4) mice at 4 wk (A) and 11–12 wk old (B). The same blots were probed with antibody to tubulin. The signal ratios of GLT-1 to tubulin are shown in the right. (C) RT-PCR analysis of the expression of GLT-1 and GLAST in R6/2 (HD) and wild-type (WT) mouse brain cortex. Transcripts for GLAST and actin were amplified in the same reaction (21 cycles), and the same amounts of cDNA were used for GLT-1 PCR (23 cycles). The ratios (mean ± SEM, n = 3) of GLT-1 (*, P = 0.0079, WT vs. HD) and GLAST (P = 0.11, WT vs. HD) to actin were obtained with densitometry. Panel C is the control RT-PCR without reverse transcriptase. (D) GLT-1–specific glutamate uptake in brain slices of littermate control (WT) and R6/2 (HD) mice at the age of 4–5 and 10–12 wk was obtained with DHK (1 mM) treatment. Data are presented as mean ± SEM (n = 4 each group). *, P < 0.05; **, P < 0.01 compared with WT control.
Figure 4.
Figure 4.
Age-dependent nuclear accumulation of mutant htt in cultured glial cells. (A) Immunofluorescence double labeling showing that GFAP (green) positive astrocytes display htt aggregates (red) in the nuclei of R6/2 glial cells. (B) Some intranuclear htt aggregates are also labeled by antibody to ubiquitin. (C) Immunofluorescent images of cultured glial cells that were cultured for 2 and 12 wk showing the increase of glial htt aggregates with time. (D) Western blotting of cultured astrocytes that were isolated from the cortex of postnatal Hdh CAG(150) knock-in (KI) and littermate control (WT) mice and had been cultured for 4 wk. The blot was probed with antitubulin (bottom) and 1C2 (top), an antibody that is specific to expanded polyQ tracts and reacts with NH2-terminal htt fragments containing 150Q. Arrow indicates full-length mutant htt. (E) Immunofluorescent images of glial culture from Hdh CAG KI. GFAP (green) positive astrocytes (arrows) contain intranuclear htt (red) aggregates. Some GFAP-negative cells (arrowhead) also show intranuclear htt, suggesting that they might be immature astrocytes or other types of cells. Bars, 5 μm.
Figure 5.
Figure 5.
Expression of mutant htt in the brains of Hdh CAG(150) knock-in mice and HD patient. (A) Immunofluorescent double labeling of the striatum of heterozygous Hdh CAG(150) knock-in mice at 14–18 mo old. Arrows indicates the nuclei (blue) of GFAP (green)-positive glial cells containing EM48 labeling (red), and arrowhead indicates a neuronal nucleus, which shows more intense EM48 labeling. (B) High magnification graphs of confocal images of white matter of heterozygous Hdh CAG(150) knock-in mice. Arrows indicate glial nuclei (blue) containing EM48 labeling (red). (C) Western blotting of caudate-putamen tissues from HD and Alzheimer's disease (AD; Control) patients. The blot was probed with antiactin (bottom) and 1C2 antibody (top). (D) Light microscopic graphs of glial cells (arrows in upper panel) in white matter and neurons in the cortex (bottom) in the EM48 stained HD brain sections. (E) Immunofluorescent double labeling of white matter of HD patient brain with rabbit anti-htt (EM48) and mouse anti-GFAP. Mutant htt (red) forms aggregates (arrow) in the nucleus (blue) of an astrocytic cell that shows intense GFAP staining (green) in its processes. The control is the AD brain section. Bars, 2 μm.
Figure 6.
Figure 6.
PolyQ-mediated intranuclear htt accumulation in glial cells. (A) Immunofluorescent images of adenovirus-infected astrocytes that express GFP-htt containing a 23- (23Q) or 130- (130Q) glutamine repeat. Immunostaining with EM48 confirms that htt-130Q is located in the nucleus and forms nuclear aggregates. Nuclei are stained with Hoechst. (B) Proteasomal inhibition by ALLN (10 μg/ml) for 5 d significantly increases the formation of nuclear aggregates of htt-130Q, but not htt-23Q, in infected glial cells. (C) MTT assay of cultured glial cells infected by adenoviral-GFP (+GFP), htt-23Q (+23Q), or htt-130Q (+130Q) for 9 d. (D) MTT assay of astrocytes from R6/2 mice (HD) or littermate controls (WT) cultured for 6 or 8 wk. The data are presented as mean ± SEM (n = 3–4) and p values for 6- and 8-wk group comparisons (WT vs. HD) are 0.23 and 0.014, respectively. Bars, 5 μm.
Figure 7.
Figure 7.
Decreased expression of GLT-1 in glial cells expressing mutant htt. (A and B) Western blots of cultured astrocytes from R6/2 (HD) and littermate control (WT) mice. Astrocytes that had been cultured 4–6 wk and treated with (+) or without (–) 0.25 mM dBcAMP were examined by Western blotting with antibodies to GFAP and GLT-1. The same blots were also probed with an antibody to tubulin. Two blots (a, b) containing different cell samples are presented. (C) Densitometric analysis of signals of immunoreactive bands. The ratios (mean ± SEM, n = 3–4) of GLAST (*, P = 0.045, WT vs. HD), GLT-1 (*, P = 0.013; **, P < 0.001 WT vs. HD), and GFAP to tubulin. (D) Western blot analysis of the expression of htt-23Q and htt-130Q in adenovirus-infected glial cells. Bracket indicates the stacking gel in which aggregated htt-130Q is present. GLT-1 expression is reduced in htt-130Q astrocytes cocultured with cortical or striatal neurons. (E) [3H]Glutamate uptake assays of astrocytes infected with htt-23Q or htt-130Q. Note that the glutamate uptake in htt-130Q–infected cells is lower than in htt-23Q infected cells. The data are presented as mean ± SEM (*, P < 0.05; **, P < 0.01). The Vmax of [3H]glutamate uptake in htt-23Q and htt-130Q infected cells was 11.1 ± 0.84 and 7.3 ± 1.21 nmol/min/mg protein, respectively. There was no significant difference in the apparent glutamate Kms (37.7 ± 3.24 and 38.6 ± 6.3 for htt-23Q and htt-130Q, respectively).
Figure 8.
Figure 8.
Htt-mediated neurotoxicity in glia–neuron coculture. (A) Cultured cortical neurons were infected with adenoviral htt-23Q or htt-130Q for 24 h. The infected neurons were then cultured with or without wild-type glial cells or MK801 (10 μM) and labeled by antibodies to htt (top), MAP2 (middle), and Hoechst (bottom). Htt-130Q–infected neurons show decreased MAP2-staining (arrows). (B) The percentage of MAP2-positive neurons and apoptotic neurons with nuclear DNA fragmentation in the presence or absence of wild-type glial cells or MK801. (C) Cultured glial cells (4–6 wk) infected with adenoviral htt-23Q or htt-130Q were cocultured with wild-type cortical neurons. EM48 immunofluorescence staining of glia–neuron coculture shows that htt-23Q is distributed in the cytoplasm whereas htt-130Q accumulates in the nuclei (arrows) of infected glial cells. The size of nuclei of cultured glial cells is often larger than that of cultured cortical neurons. There is a decrease in the number of MAP2-positive neurons in the coculture with htt-130Q–infected glial cells. Nuclei were stained with Hoechst (blue). (D) The percentage of MAP2-positive neurons and apoptotic cells in the presence of adenoviral infected glial cells. Neurons were treated with or without MK801 (10 μM). The data (mean ± SEM) were obtained by counting the number of degenerated cells and the total number of nuclei per image. **, P < 0.01 compared with neurons cocultured with glial cells. Bars, 10 μm.
Figure 9.
Figure 9.
Reduced glial protection against glutamate excitotoxicity by mutant htt in R6/2 astrocytes. (A) Cultured rat striatal neurons (15–17 DIV) were stimulated for 1 h with glutamate (0.1 mM) or NMDA (0.4 mM) in the absence (−glia) or presence (+glia) of wild-type rat cortical astrocytes. The astrocytes were removed after the stimulation. Glutamate stimulation caused neurons to degenerate and lose MAP2 staining. Wild-type astrocytes increased MAP2-positive neurons following glutamate (0.1 mM), but not NMDA (0.4 mM) stimulation, suggesting a specific protection resulting from their glutamate uptake. (B) Cultured astrocytes from littermate control (+WT glia) mouse cortex also protected against glutamate neuronal toxicity. Cultured astrocytes from R6/2 (+HD glia) mouse cortex, however, showed a decrease in protection against glutamate (0.1 mM), but not NMDA (0.4 mM), toxicity. (C) Cultured R6/2 astrocytes contained GFAP (green) in the cytoplasm and mutant htt (red) in their nuclei but had normal nuclear morphological appearance (blue). (D) The percentage of MAP2-positive striatal or cortical neurons after glutamate stimulation in the absence (No glia) or presence of wile type (+WT glia) or R6/2 (+HD glia) astrocytes. (E) The percentage of MAP2-positive striatal neurons after NMDA stimulation. The control is the number of cells without excitotoxin stimulation. The data (mean ± SEM) were obtained from four to five independent coculture experiments. *, P < 0.05; *, P < 0.01 as compared with WT astrocytes. Bars: (A and B) 20 μm; (C) 5 μm.

References

    1. Beal, M.F. 1994. Huntington's disease, energy, and excitotoxicity. Neurobiol. Aging. 15:275–276. - PubMed
    1. Behrens, P.F., P. Franz, B. Woodman, K.S. Lindenberg, and G.B. Landwehrmeyer. 2002. Impaired glutamate transport and glutamate-glutamine cycling: downstream effects of the Huntington mutation. Brain. 125:1908–1922. - PubMed
    1. Calabresi, P., D. Centonze, A. Pisani, G. Sancesario, P. Gubellini, G.A. Marfia, and G. Bernardi. 1998. Striatal spiny neurons and cholinergic interneurons express differential ionotropic glutamatergic responses and vulnerability: implications for ischemia and Huntington's disease. Ann. Neurol. 43:586–597. - PubMed
    1. Cepeda, C., M.A. Ariano, C.R. Calvert, J. Flores-Hernandez, S.H. Chandler, B.R. Leavitt, M.R. Hayden, and M.S. Levine. 2001. NMDA receptor function in mouse models of Huntington disease. J. Neurosci. Res. 66:525–539. - PubMed
    1. Clement, A.M., M.D. Nguyen, E.A. Roberts, M.L. Garcia, S. Boillee, M. Rule, A.P. McMahon, W. Doucette, D. Siwek, R.J. Ferrante, et al. 2003. Wild-type nonneuronal cells extend survival of SOD1 mutant motor neurons in ALS mice. Science. 302:113–117. - PubMed

Publication types

MeSH terms

Substances