

Class II-restricted T cell receptor engineered in vitro for higher affinity retains peptide specificity and function
- PMID: 16365315
- PMCID: PMC1323173
- DOI: 10.1073/pnas.0507554102
Class II-restricted T cell receptor engineered in vitro for higher affinity retains peptide specificity and function
Abstract
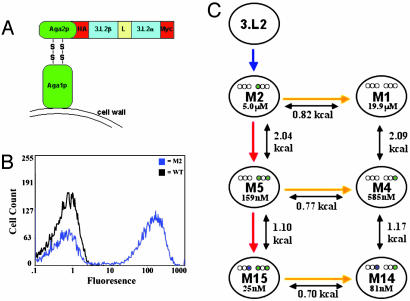
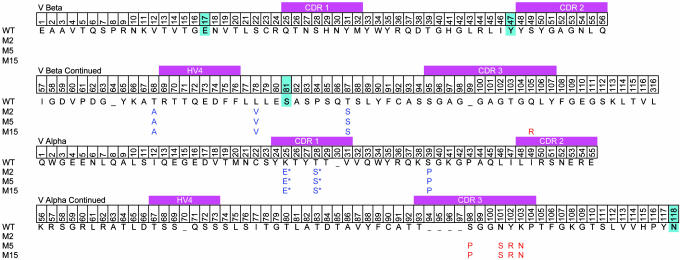
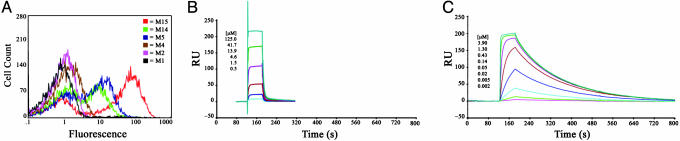
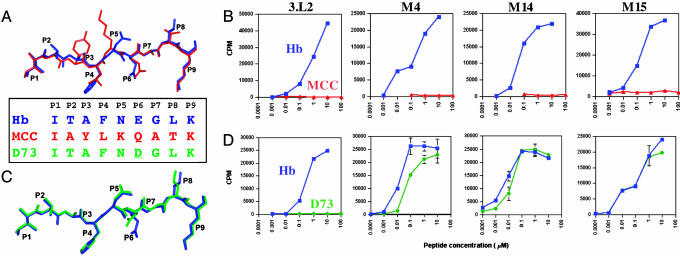
The T cell receptor (TCR) alphabeta heterodimer determines the peptide and MHC specificity of a T cell. It has been proposed that in vivo selection processes maintain low TCR affinities because T cells with higher-affinity TCRs would (i) have reduced functional capacity or (ii) cross-react with self-peptides resulting in clonal deletion. We used the class II-restricted T cell clone 3.L2, specific for murine hemoglobin (Hb/I-E(k)), to explore these possibilities by engineering higher-affinity TCR mutants. A 3.L2 single-chain TCR (Vbeta-linker-Valpha) was mutagenized and selected for thermal stability and surface expression in a yeast display system. Stabilized mutants were used to generate a library with CDR3 mutations that were selected with Hb/I-E(k) to isolate a panel of affinity mutants with K(D) values as low as 25 nM. Kinetic analysis of soluble single-chain TCRs showed that increased affinities were the result of both faster on-rates and slower off-rates. T cells transfected with the mutant TCRs and wild-type TCR responded to similar concentrations of peptide, indicating that the increased affinity was not detrimental to T cell activation. T cell transfectants maintained exquisite hemoglobin peptide specificity, but an altered peptide ligand that acted as an antagonist for the wild-type TCR was converted to a strong agonist with higher-affinity TCRs. These results show that T cells with high-affinity class II reactive TCRs are functional, but there is an affinity threshold above which an increase in affinity does not result in significant enhancement of T cell activation.
Figures
Similar articles
-
The study of high-affinity TCRs reveals duality in T cell recognition of antigen: specificity and degeneracy.J Immunol. 2006 Nov 15;177(10):6911-9. doi: 10.4049/jimmunol.177.10.6911. J Immunol. 2006. PMID: 17082606
-
High affinity T cell receptors from yeast display libraries block T cell activation by superantigens.J Mol Biol. 2001 Apr 13;307(5):1305-15. doi: 10.1006/jmbi.2001.4560. J Mol Biol. 2001. PMID: 11292343
-
In vitro evolution of a T cell receptor with high affinity for peptide/MHC.Proc Natl Acad Sci U S A. 2000 May 9;97(10):5387-92. doi: 10.1073/pnas.080078297. Proc Natl Acad Sci U S A. 2000. PMID: 10779548 Free PMC article.
-
Modulation of T cell function by TCR/pMHC binding kinetics.Immunobiology. 2006;211(1-2):47-64. doi: 10.1016/j.imbio.2005.09.003. Epub 2006 Jan 4. Immunobiology. 2006. PMID: 16446170 Review.
-
T cells and their eons-old obsession with MHC.Immunol Rev. 2012 Nov;250(1):49-60. doi: 10.1111/imr.12004. Immunol Rev. 2012. PMID: 23046122 Free PMC article. Review.
Cited by
-
Structural features of T cell receptor variable regions that enhance domain stability and enable expression as single-chain ValphaVbeta fragments.Mol Immunol. 2009 Feb;46(5):902-16. doi: 10.1016/j.molimm.2008.09.021. Epub 2008 Oct 29. Mol Immunol. 2009. PMID: 18962897 Free PMC article.
-
Fine-tuning of T-cell receptor avidity to increase HIV epitope variant recognition by cytotoxic T lymphocytes.AIDS. 2010 Nov 13;24(17):2619-28. doi: 10.1097/QAD.0b013e32833f7b22. AIDS. 2010. PMID: 20881472 Free PMC article.
-
Subtle changes in TCRα CDR1 profoundly increase the sensitivity of CD4 T cells.Mol Immunol. 2013 Mar;53(3):283-94. doi: 10.1016/j.molimm.2012.08.020. Epub 2012 Sep 14. Mol Immunol. 2013. PMID: 22982754 Free PMC article.
-
TCR affinity and specificity requirements for human regulatory T-cell function.Blood. 2012 Apr 12;119(15):3420-30. doi: 10.1182/blood-2011-09-377051. Epub 2012 Feb 7. Blood. 2012. PMID: 22318202 Free PMC article.
-
Changing the peptide specificity of a human T-cell receptor by directed evolution.Nat Commun. 2014 Nov 7;5:5223. doi: 10.1038/ncomms6223. Nat Commun. 2014. PMID: 25376839 Free PMC article.
References
-
- Starr, T. K., Jameson, S. C. & Hogquist, K. A. (2003) Annu. Rev. Immunol. 21, 139-176. - PubMed
-
- Davis, M. M., Boniface, J. J., Reich, Z., Lyons, D., Hampl, J., Arden, B. & Chien, Y. (1998) Annu. Rev. Immunol. 16, 523-544. - PubMed
-
- Gascoigne, N. R. J., Zai, T. & Alam, S. M. (2001) Exp. Rev. Mol. Med., http://www-ermm.cbcu.cam.ac.uk/01002502h.htm. - PubMed
Publication types
MeSH terms
Substances
Grants and funding
LinkOut - more resources
Full Text Sources
Other Literature Sources
Research Materials
