. 2006 Feb;4(2):e31.
doi: 10.1371/journal.pbio.0040031. Epub 2005 Dec 27.

Sirt1 regulates insulin secretion by repressing UCP2 in pancreatic beta cells

Affiliations

Sirt1 regulates insulin secretion by repressing UCP2 in pancreatic beta cells

Laura Bordone et al. PLoS Biol. 2006 Feb.

Erratum in

Abstract

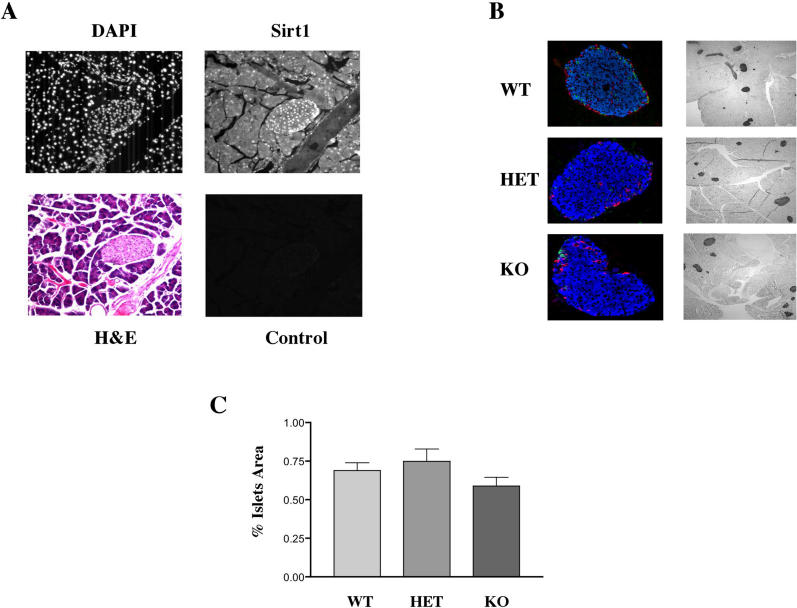
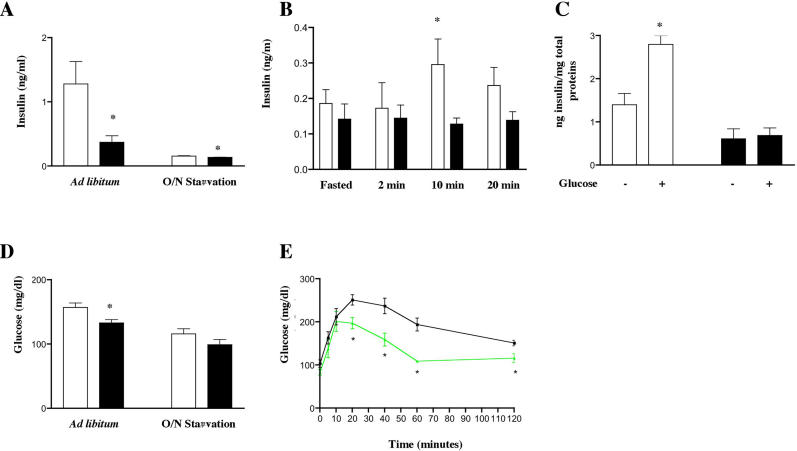
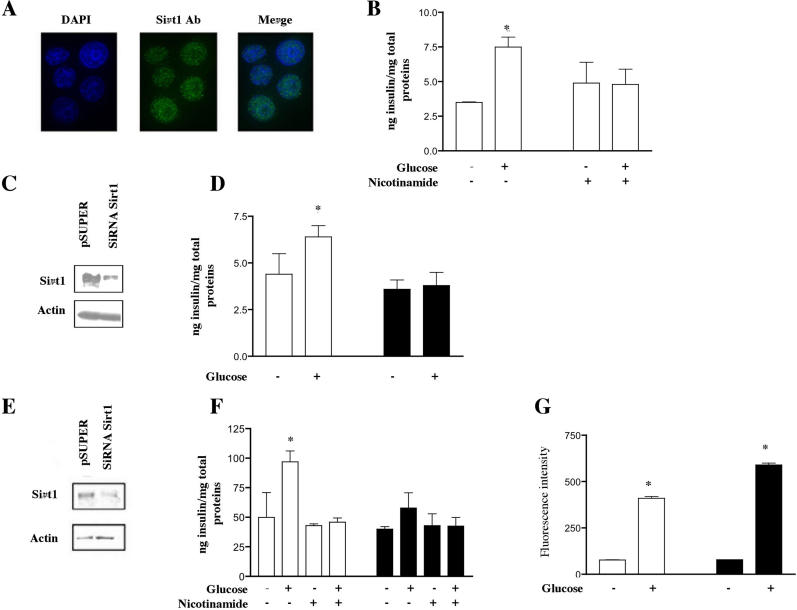
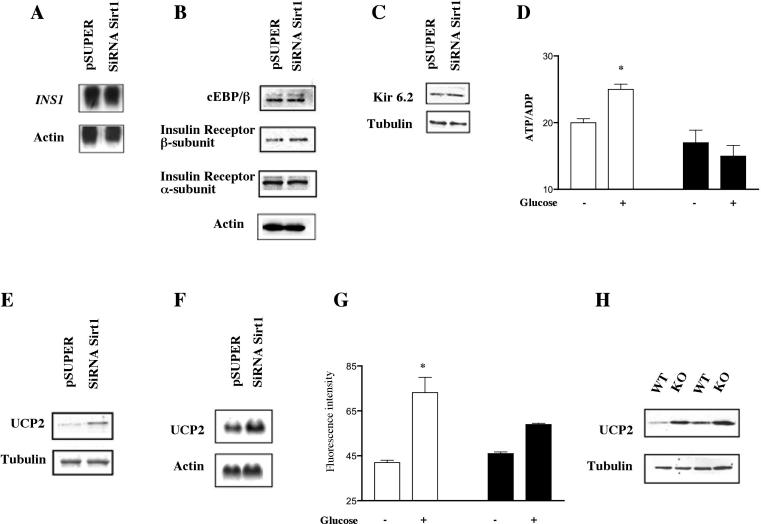
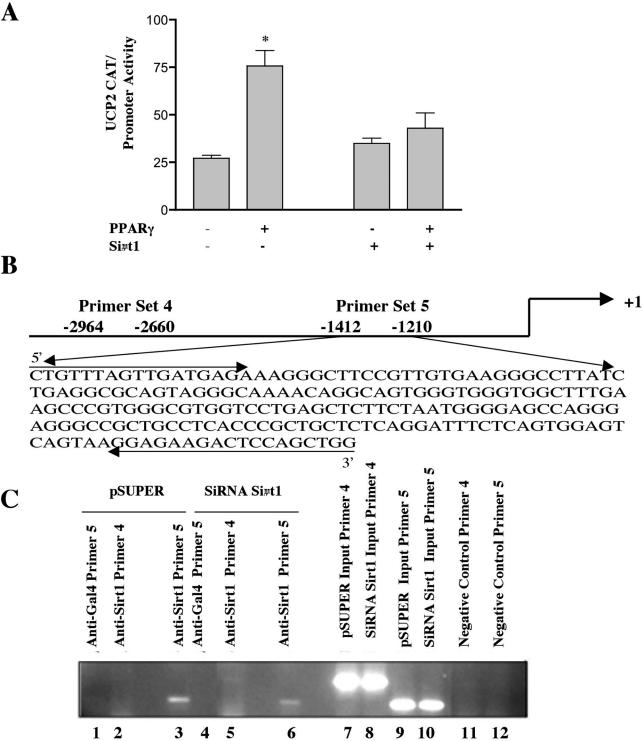
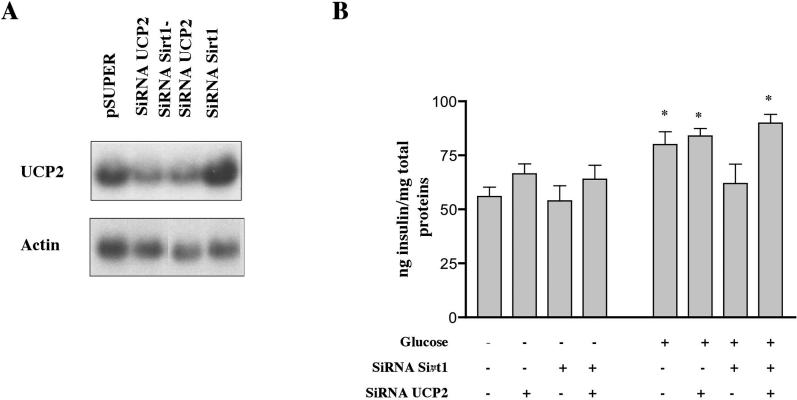
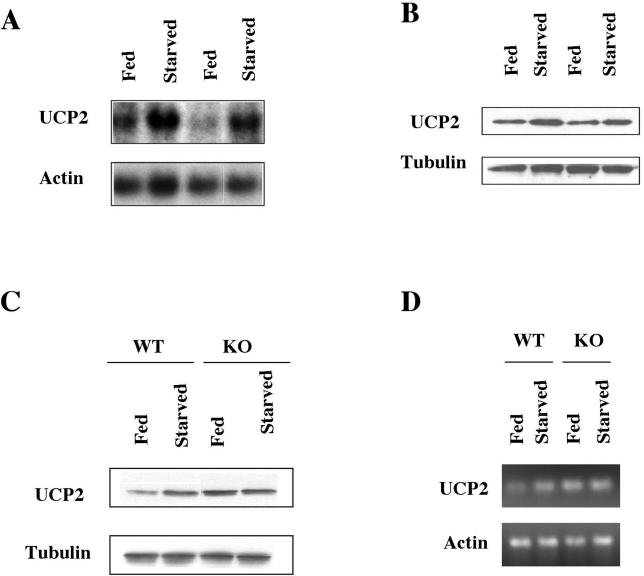
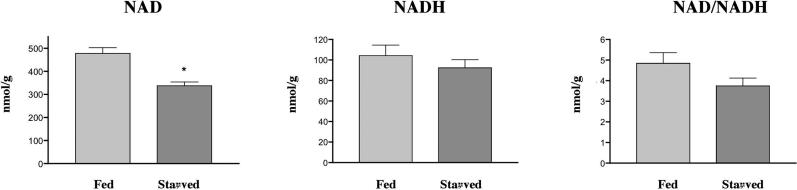
Sir2 and insulin/IGF-1 are the major pathways that impinge upon aging in lower organisms. In Caenorhabditis elegans a possible genetic link between Sir2 and the insulin/IGF-1 pathway has been reported. Here we investigate such a link in mammals. We show that Sirt1 positively regulates insulin secretion in pancreatic beta cells. Sirt1 represses the uncoupling protein (UCP) gene UCP2 by binding directly to the UCP2 promoter. In beta cell lines in which Sirt1 is reduced by SiRNA, UCP2 levels are elevated and insulin secretion is blunted. The up-regulation of UCP2 is associated with a failure of cells to increase ATP levels after glucose stimulation. Knockdown of UCP2 restores the ability to secrete insulin in cells with reduced Sirt1, showing that UCP2 causes the defect in glucose-stimulated insulin secretion. Food deprivation induces UCP2 in mouse pancreas, which may occur via a reduction in NAD (a derivative of niacin) levels in the pancreas and down-regulation of Sirt1. Sirt1 knockout mice display constitutively high UCP2 expression. Our findings show that Sirt1 regulates UCP2 in beta cells to affect insulin secretion.


Figures

Figure 1
Figure 1. Sirt1 Is Localized in the Islets of Langerhans
The pancreas of wild-type mice was sectioned and stained as described. (A) Nuclear staining using DAPI (top left). Immunofluorescence using Sirt1 antibody (top right); hematoxylin and eosin staining of the same section of pancreas (bottom left); immunofluorescence control using a rabbit secondary antibody (bottom right). (B) Pancreases of wild-type (WT), Sirt1+/− heterozygotes (HET), or Sirt1−/− homozygous KO mice were stained with antibodies against insulin (blue), glucagon (red), or somatostatin (green) (shown in left column). Representative islets of mice of all three genotypes are shown. Pancreases were also silver-stained for morphometry (right column). Islets appear as dark figures and their area was determined by scanning, using Image-Pro 4.1 Plus software. (C) The areas are shown as percentage of area of the entire pancreas.
Figure 2
Figure 2. Sirt1 KO Mice Have a Lower Level of Insulin
(A) Plasma insulin levels in wild-type (open bars) or Sirt1 KO mice (black bars) ad libitum or after O/N starvation (n = 12 wild-type, 11 KO, *p < 0.03 in ad libitum and O/N starvation mice, ANOVA). (B) Plasma insulin levels in Sirt1 KO mice (black bar) compared with wild-type mice (open bars) 2, 10, or 20 min after injection with glucose (n = 4 or 5, *p < 0.05 compared with wild-type, ANOVA). (C) Insulin secretion in islets isolated from wild-type (open bars) or Sirt1 KO mice (black bars) after induction by 20 mM glucose for 1 h (n = 4, *p < 0.005 in wild-type, ANOVA). (D) Glucose levels in wild-type (open bars) and Sirt1 KO (black bars) mice (n = 12 wild-type, 11 KO, *p < 0.03 ad libitum, ANOVA). (E) Glucose tolerance tests in wild-type (black) and Sirt1 KO (green) mice (n = 6, *p < 0.05 at 20, 40, 60, and 120 min).
Figure 3
Figure 3. Sirt1 Is a Positive Regulator of Insulin Secretion in INS-1 and MIN6 Cells
(A) Immunofluorescence in INS-1 cells using Sirt1 antibody (green) and DAPI staining (blue). Nuclear localization of Sirt1 is evident. (B) Induction of insulin secretion in INS-1 cells with 16.7 mM glucose (+) compared with 4 mM glucose control (−). The left side shows no nicotinamide and the right side shows treatment with 10 mM nicotinamide for 48 h prior to induction (n = 3 experiments done in triplicate, *p < 0.05 in the no nicotinamide experiment, ANOVA). (C) Western blot of Sirt1 in INS-1 cells with knockdown levels of the protein (SiRNA Sirt1) compared with control cells (pSUPER). (D) INS-1 cells infected with the pSUPERretro SiRNA-GFP control (open bars) or pSUPER retro SiRNA-Sirt1 knockdown cells (black bars) were induced for insulin secretion as in (B) (n = 3 experiments done in triplicate, *p < 0.008 in the control experiment, ANOVA). (E) Western blot of Sirt1 in MIN6 cells with knockdown levels of the protein (SiRNA Sirt1) compared with control cells (pSUPER). (F) Glucose induction (20 mM versus 4 mM) of insulin secretion in MIN6 cells with the pSUPER control vector (open bars) or the SiRNA Sirt1 vector (black bars) in the absence or presence of nicotinamide (n = 3 experiments done in triplicate*p < 0.05 in the control without nicotinamide, ANOVA). (G) Glucose uptake in INS-1 cells stably transfected with control or SiRNA Sirt1 vectors. 2-NBDG fluorescence was determined by flow cytometry 10 min after addition and expressed as arbitrary units (n = 2, *p < 0.0005 compared with no glucose).
Figure 4
Figure 4. UCP2 is Up-Regulated in Sirt1 Knockdown Cells and in Sirt1 KO Mice
(A) Northern blot for the insulin gene INS-1 in cells with a control vector (pSUPER) or a SiRNA-Sirt1 vector (SiRNA Sirt1). (B and C) Western blot analyses of targets involved in insulin synthesis and secretion using specific antibodies: cEBP/β, insulin receptor α and β, and kir6.2, one of the K+ channel receptor subunits. (D) Measurement of ATP/ADP levels in INS-1 control cells (open bars) or Sirt1 knockdown cells (black bars) treated with 16.7 mM glucose (+) or 4 mM glucose (−) (n = 3 experiments done in triplicate, *p < 0.005 in the pSUPER experiment; ANOVA). (E) Western blot analysis for UCP2 in INS-1 control cells (pSUPER) or knockdown cells (SiRNA Sirt1). (F) Northern blot analysis for UCP2 in INS-1 control cells (pSUPER) or knockdown cells (SiRNA Sirt1). (G) NADH levels in INS-1 cells after glucose addition as determined by autofluorescence [46] and expressed as arbitrary units. Cells stably transfected with control or Sirt1 SiRNA vectors were used (n = 2, *p < 0.05 compared with no glucose). (H) UCP2 protein levels in isolated pancreatic islets of two wild-type or two Sirt1 KO mice. Tubulin or actin was used as loading control in all Western and Northern blots.
Figure 5
Figure 5. Sirt1 Binds at the UCP2 Promoter and Represses the Gene
(A) In vitro CAT assay. 293T cells were transfected with a CAT reporter driven by the UCP2 promoter. Cells were also co-transfected with Sirt1 or not and with PPARγ or not, as indicated. CAT activity was determined (n = 3 experiments done in triplicate, *p < 0.05 in the no Sirt1 transfection experiment, ANOVA). (B) Schematic representation of the primer sets (arrows) in the UCP2 promoter (shown schematically and with excerpted DNA sequence). (C) Chromatin-immunoprecipitation (IP) was carried out on INS-1 control cells (lanes 1–3) or Sirt1 knockdown cells (columns 4–6) using Sirt1 antibody or a Gal4 control antibody, as indicated. PCR was carried out with the indicated primers. INPUT (columns 7–10) refers to PCR carried out on samples prepared prior to immunoprecipitation. Negative controls for the PCR (minus DNA) are also indicated (columns 11 and 12).
Figure 6
Figure 6. Knockdown of UCP2 in Sirt1 Knockdown Cells Restores Glucose-Induced Insulin Secretion
(A) Northern blot for UCP2 RNA in control INS-1 cells, and cells knocked down for Sirt1 (SiRNA Sirt1), UCP2 (SiRNA UCP2), or both Sirt1 and UCP2 (SiRNA Sirt1-SiRNA UCP2). RNAs were quantitated by densitometry, setting the level of UCP2 in control cells at 1.0. (B) Insulin secretion in INS-1 control cells and cells with knockdown levels of Sirt1, UCP2, or both Sirt1 and UCP2 after treatment with 16.7 mM glucose (+) or 4mM glucose (−) for 1 h (n = 3 experiments done in triplicate, *p < 0.05 in SiRNA Sirt1-SiRNA UCP2, ANOVA).
Figure 7
Figure 7. UCP2 mRNA or Protein Levels in Fed or Starved Wild-Type Mice
(A) Northern blot for UCP2 in whole pancreas of two ad libitum mice and two mice starved for 18 h. (B) Western blot for UCP2 in isolated islets in two ad libitum and two starved mice. (C) Western blot for UCP2 in wild-type (WT) or Sirt1 KO littermates either fed ad libitum or starved for 18 h. The experiment shown is representative of four pairs of wild-type and KO littermates analyzed. (D) RT-PCR for UCP2 in wild-type or Sirt1 KO mice fed or starved.
Figure 8
Figure 8. NAD and NADH Levels in Fed and Starved Mice
Measurements were made in pancreases of seven fed and seven starved wild-type mice, and levels are expressed as nmol per gram of tissue. The decrease in NAD in starved mice is significant with p < 0.0005, while the NADH levels in fed versus starved are not significantly different.

Comment in

References

    1. Saltiel AR, Kahn CR. Insulin signalling and the regulation of glucose and lipid metabolism. Nature. 2001;414:799–806. - PubMed
    1. McCay CM, Crowell MF, Maynard LA. The effect of retarded growth upon the length of life span and upon the ultimate body size. J Nutr. 1935;10:63–79. - PubMed
    1. Anderson RM, Bitterman KJ, Wood JG, Medvedik O, Cohen H, et al. Manipulation of a nuclear NAD+ salvage pathway delays aging without altering steady-state NAD+ levels. J Biol Chem. 2002;277:18881–18890. - PubMed
    1. Weindruch R, Walford RL. The retardation of aging and disease by dietary restriction. Springfield (Illinois): Charles C Thomas; 1988. 436 pp.
    1. Barrows CH, Kokkonen GC. Dietary restriction and life extension, biological mechanisms. In: Moment GB, editor. Nutritional approaches to aging research. Boca Raton (Florida): CRC Press; 1982. pp. 219–243.

Publication types

MeSH terms