. 2006 Jan;143(1):30-40.
doi: 10.1111/j.1365-2249.2005.02969.x.

B cells from aged mice exhibit reduced apoptosis upon B-cell antigen receptor stimulation and differential ability to up-regulate survival signals

Affiliations

B cells from aged mice exhibit reduced apoptosis upon B-cell antigen receptor stimulation and differential ability to up-regulate survival signals

C L Montes et al. Clin Exp Immunol. 2006 Jan.

Abstract

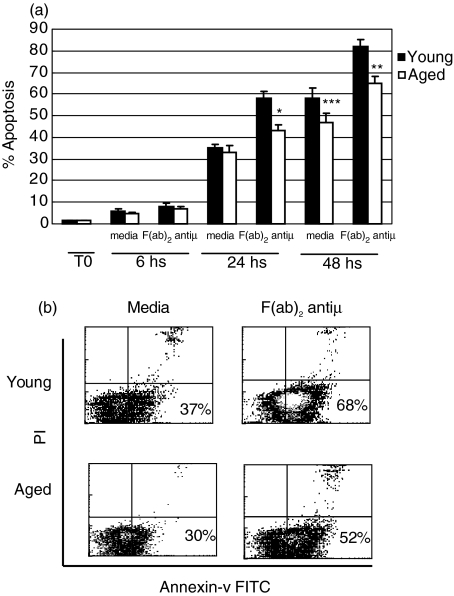
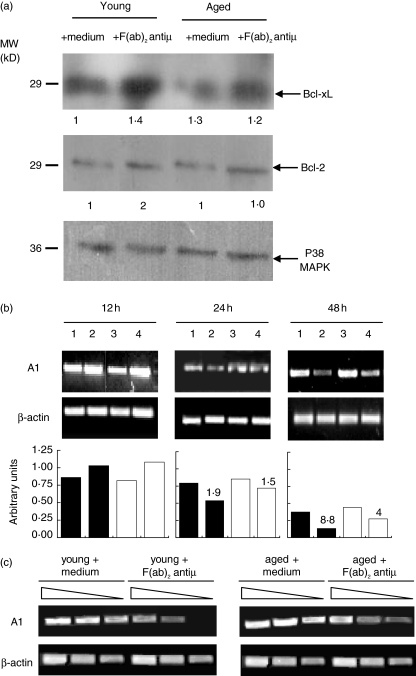
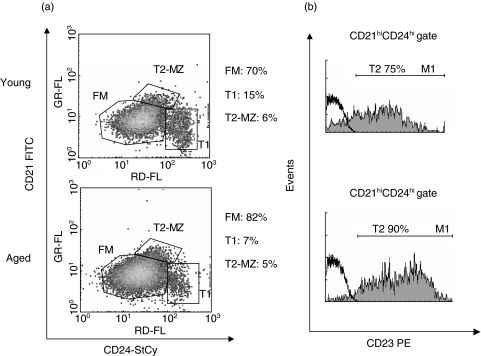
During ageing, autoimmune disorders and the higher susceptibility to infectious have been associated with alterations in the humoral immune response. We report that splenic B lymphocytes from aged mice exhibit lower level of apoptosis induced by B-cell antigen receptor (BCR) ligation in vitro. Respect to B cells from young mice the anti-mu stimulated aged B cells show similar Bcl-2 and Bcl-xL expression but differential kinetic of A1 degradation and a higher level of cFLIP and FAIM. Even though B cells from aged mice show minor Fas expression they exhibit the same susceptibility to anti-Fas induced apoptosis. Aged B cells also present upon BCR stimulation, a higher proliferative response and similar level of activation markers expression than B cells from young mice. These data agree with the observation that aged mice exhibit an increment of T2 and mature B cell subset which rapidly enters cell cycle upon BCR engagement. The diminished apoptosis after activation in aged mice could compromise homeostatic mechanism allowing the persistence of self and non-self antigen specific B cells.


Figures

Fig. 1
Fig. 1
Apoptosis of B lymphocytes in young and old mice. (a) Purified B cells from young (▪) and aged (□) mice were cultured with medium alone or F(ab)2 anti-µ (10 µg/ml) during 6, 24 and 48 h. Cell nuclei from freshly (T0) explanted B cells or after culture were stained with PI and the cells were subjected to hyplodiploid DNA content analysis by FCM. The graph shows the percentages of apoptotic B cells. *P < 0·04 and **P < 0·035 indicate significant differences compared with stimulated-B cells from young animals and ***P = 0·13 indicate non-significant differences compared with nonstimulated B cells from young mice. (b) Purified B cells from young and aged mice were cultured with medium alone or F(ab)2 anti-µ (10 µg/ml) during 24 h. Then, the cells were stained with FITC-Annexin–V and PI. Two-colour density plot graphics show the percentage of Annexin-V+ cells within live gated population. One typical experiment from the three performed is shown.
Fig. 2
Fig. 2
Expression of Bcl-2, Bcl-xL and A1. (a) Purified B cells from young and aged mice were cultured with medium alone or F(ab)2 anti-µ (10 µg/ml) during 24 h. The expression of Bcl-2 and Bcl-xL was determined by Western blot. p38 MAPK expression was used to determine parity of loading. The densitometric values of Bcl-2 and Bcl-xl expression are shown in relative arbitrary units at the bottom of the figure. (b) Purified B cells from young and aged mice were cultured with medium alone or F(ab)2 anti-µ for 12, 24 and 48 h. RT-PCR was performed to detect A1transcripts. Number 1 and 3 represent B cells from young and aged mice, respectively, incubated with media alone, number 2 and 4 represent B cells from young and aged mice, respectively, stimulated with F(ab)2 anti-µ. The densitometric profile of A1 expression is shown in relative arbitrary units. (c) Purified B cells from young and aged mice were cultured with medium alone or F(ab)2 anti-µ for 48 h. Semi-quantitative PCR was performed to detect A1transcripts in serial dilutions of cDNA samples. In (b) and (c), β-actin was used as internal control of RNA integrity and equal loading. Immunoblotting for A1 could not be done due to the poor quality of commercially available Ab reagents. In (a–c) one typical experiment from the three performed is shown.
Fig. 3
Fig. 3
Fas expression on B cells from young and aged mice. Purified B cells from young and aged mice were cultured with F(ab)2 anti-µ (10 µg/ml) or media alone during 24 and 48 h. In all figures grey histograms represent B cells stained with FITC labelled anti-Fas Ab while staining with isotype control Ab is shown as thick black line histograms. One typical experiment from the three performed is shown. The statistical study was performed with One sample t-test.
Fig. 4
Fig. 4
Fas–mediated apoptosis susceptibility and expression of antiapoptotic molecules. (a) Purified B cells from young and aged mice were cultured with F(ab)2 anti-µ (10 µg/ml) during 40 h. The cells were washed and incubated during 12 h more with hamster IgG (a,c) or anti-Fas Ab (Jo2) (0·125 µg/ml) (b,d). B cells were stained with PI and subjected to hyplodiploid DNA content analysis by FCM. M1 indicates the percentage of apoptotic B cells. The asterisks indicate significant differences *P < 0·04 compared with B cells from young animals cultured with anti-Fas antibody. (b) Purified B cells from young and aged mice were cultured with medium alone or F(ab)2 anti-µ (10 µg/ml) during 24 h. The expression of cIAP2 and cFlipL was determined by Western blot. p38 MAPK expression was used to determine parity of loading. Semi-quantitative RT-PCR was performed to detect FAIM. β-actin was used as internal control of RNA integrity and equal loading. The densitometric values of cIAP2, cFlipL and FAIM expression are shown in relative arbitrary units at the bottom of the figure. In A-B one typical experiment from the three performed is shown.
Fig. 5
Fig. 5
Proliferative response of B cell from young and aged mice Purified B cells from young (▪) and aged mice (□) were cultured with medium alone or F(ab)2 anti-µ for 24 and 48 h and the[3H] thymidine uptake (cpm) was measured. Results represent the mean + SD. The data are representative of three independent experiments. The asterisks indicate significant differences *P < 0·02 compared with stimulated-B cells from young animals.
Fig. 6
Fig. 6
Splenic B cell subset from young and aged mice. Splenocytes from young and aged mice were stained with anti-mouse CD21, CD24, CD19 and CD23 mAbs. (a) Two-colour dot plot graphics show the percentage of T1, T2-MZ and FM B cells within CD19+ gated population. (b) Gray histogram represent CD23 surface expression within CD21high CD24high gated population. Isotype control Ab is shown as thick black line histograms. One typical experiment from the three performed is shown.

References

    1. Kay MM, Makinodan T. Relationship between aging and immune system. Prog Allergy. 1981;29:134–81. - PubMed
    1. LeMaoult J, Szabo P, Weksler ME. Effect of age on humoral immunity, selection of the B-cell repertoire and B-cell development. Immunol Rev. 1997;160:115–26. - PubMed
    1. Schneider EL. Infectious diseases in the elderly. Ann Intern Med. 1983;98:395–400. - PubMed
    1. Yang X, Stedra J, Cerny J. Relative contribution of T and B cells to hypermutation and selection of the antibody repertoire in germinal centers of aged mice. J Exp Med. 1996;183:959–70. - PMC - PubMed
    1. Miller RA. The aging immune system: primer and prospectus. Science. 1996;273:70–4. - PubMed

Publication types

MeSH terms