

Direct evidence for S-nitrosation of mitochondrial complex I
- PMID: 16371007
- PMCID: PMC1383712
- DOI: 10.1042/BJ20051435
Direct evidence for S-nitrosation of mitochondrial complex I
Abstract
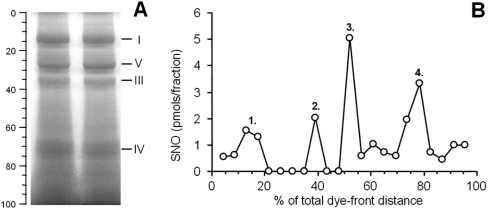
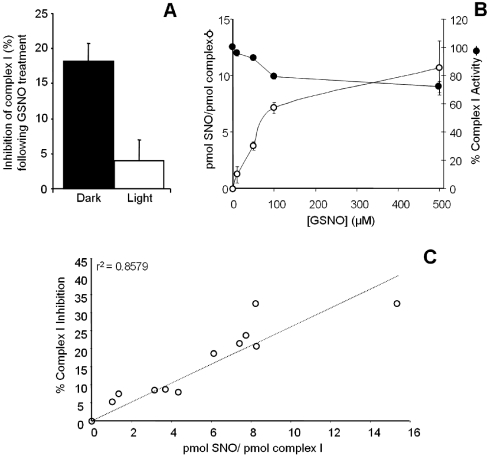
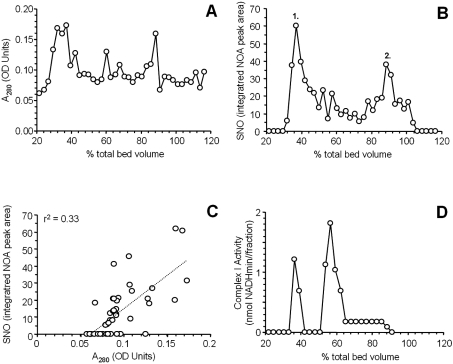
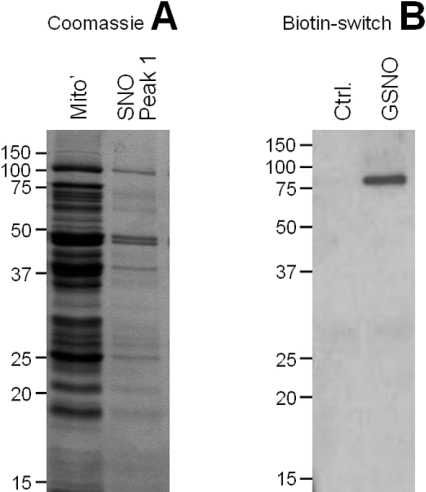
NO* (nitric oxide) is a pleiotropic signalling molecule, with many of its effects on cell function being elicited at the level of the mitochondrion. In addition to the well-characterized binding of NO* to the Cu(B)/haem-a3 site in mitochondrial complex IV, it has been proposed by several laboratories that complex I can be inhibited by S-nitrosation of a cysteine. However, direct molecular evidence for this is lacking. In this investigation we have combined separation techniques for complex I (blue-native gel electrophoresis, Superose 6 column chromatography) with sensitive detection methods for S-nitrosothiols (chemiluminescence, biotin-switch assay), to show that the 75 kDa subunit of complex I is S-nitrosated in mitochondria treated with S-nitrosoglutathione (10 microM-1 mM). The stoichiometry of S-nitrosation was 7:1 (i.e. 7 mol of S-nitrosothiols per mol of complex I) and this resulted in significant inhibition of the complex. Furthermore, S-nitrosothiols were detected in mitochondria isolated from hearts subjected to ischaemic preconditioning. The implications of these results for the physiological regulation of respiration, for reactive oxygen species generation and for a potential role of S-nitrosation in cardioprotection are discussed.
Figures


Comment in
-
S-nitrosation and thiol switching in the mitochondrion: a new paradigm for cardioprotection in ischaemic preconditioning.Biochem J. 2008 Jun 1;412(2):e11-3. doi: 10.1042/BJ20080716. Biochem J. 2008. PMID: 18466111
Similar articles
-
Cardioprotection and mitochondrial S-nitrosation: effects of S-nitroso-2-mercaptopropionyl glycine (SNO-MPG) in cardiac ischemia-reperfusion injury.J Mol Cell Cardiol. 2007 Apr;42(4):812-25. doi: 10.1016/j.yjmcc.2007.01.010. Epub 2007 Jan 31. J Mol Cell Cardiol. 2007. PMID: 17350035 Free PMC article.
-
Persistent S-nitrosation of complex I and other mitochondrial membrane proteins by S-nitrosothiols but not nitric oxide or peroxynitrite: implications for the interaction of nitric oxide with mitochondria.J Biol Chem. 2006 Apr 14;281(15):10056-65. doi: 10.1074/jbc.M512203200. Epub 2006 Feb 14. J Biol Chem. 2006. PMID: 16481325
-
S-nitrosation and thiol switching in the mitochondrion: a new paradigm for cardioprotection in ischaemic preconditioning.Biochem J. 2008 Jun 1;412(2):e11-3. doi: 10.1042/BJ20080716. Biochem J. 2008. PMID: 18466111
-
Unraveling the S-nitrosoproteome: tools and strategies.Proteomics. 2009 Feb;9(4):808-18. doi: 10.1002/pmic.200800546. Proteomics. 2009. PMID: 19160395 Review.
-
Detection and proteomic identification of S-nitrosated proteins in human hepatocytes.Methods Enzymol. 2008;440:273-81. doi: 10.1016/S0076-6879(07)00817-8. Methods Enzymol. 2008. PMID: 18423224 Review.
Cited by
-
Effect of S-nitrosoglutathione on renal mitochondrial function: a new mechanism for reversible regulation of manganese superoxide dismutase activity?Free Radic Biol Med. 2013 Mar;56:54-63. doi: 10.1016/j.freeradbiomed.2012.12.001. Epub 2012 Dec 12. Free Radic Biol Med. 2013. PMID: 23246566 Free PMC article.
-
Modulation of myocardial contraction by peroxynitrite.Front Physiol. 2012 Dec 12;3:468. doi: 10.3389/fphys.2012.00468. eCollection 2012. Front Physiol. 2012. PMID: 23248603 Free PMC article.
-
Effects of inhalation of low-dose nitrite or carbon monoxide on post-reperfusion mitochondrial function and tissue injury in hemorrhagic shock swine.Crit Care. 2015 Apr 22;19(1):184. doi: 10.1186/s13054-015-0903-z. Crit Care. 2015. PMID: 25899004 Free PMC article.
-
Study of respiratory chain dysfunction in heart disease.J Cardiovasc Thorac Res. 2018;10(1):1-13. doi: 10.15171/jcvtr.2018.01. Epub 2018 Mar 17. J Cardiovasc Thorac Res. 2018. PMID: 29707171 Free PMC article. Review.
-
Mitochondrial reserve capacity in endothelial cells: The impact of nitric oxide and reactive oxygen species.Free Radic Biol Med. 2010 Apr 1;48(7):905-14. doi: 10.1016/j.freeradbiomed.2010.01.015. Epub 2010 Jan 20. Free Radic Biol Med. 2010. PMID: 20093177 Free PMC article.
References
-
- Stamler J. S., Lamas S., Fang F. C. Nitrosylation: the prototypic redox-based signalling mechanism. Cell (Cambridge, Mass.) 2001;106:675–683. - PubMed
-
- Miersch S., Mutus B. Protein S-nitrosation: biochemistry and characterization of protein thiol-NO interactions as cellular signals. Clin. Biochem. 2005;38:777–791. - PubMed
-
- Mannick J. B., Hausladen A., Liu L., Hess D. T., Zeng M., Miao Q. X., Kane L. S., Gow A. J., Stamler J. S. Fas-induced caspase denitrosylation. Science (Washington, D.C.) 1999;284:651–654. - PubMed
-
- Borutaite V., Budriunaite A., Brown G. C. Reversal of nitric oxide-, peroxynitrite- and S-nitrosothiol-induced inhibition of mitochondrial respiration or complex I activity by light and thiols. Biochim. Biophys. Acta. 2000;1459:405–412. - PubMed
Publication types
MeSH terms
Substances
Grants and funding
LinkOut - more resources
Full Text Sources
Other Literature Sources