Comparative Study
. 2006 Jan 3;103(1):212-7.
doi: 10.1073/pnas.0509763102. Epub 2005 Dec 21.

Gialpha and Gbeta subunits both define selectivity of G protein activation by alpha2-adrenergic receptors

Affiliations
Comparative Study

Gialpha and Gbeta subunits both define selectivity of G protein activation by alpha2-adrenergic receptors

Scott K Gibson et al. Proc Natl Acad Sci U S A. .

Abstract

Previous studies of the specificity of receptor interactions with G protein subunits in living cells have relied on measurements of second messengers or other downstream responses. We have examined the selectivity of interactions between alpha2-adrenergic receptors (alpha2R) and various combinations of Gialpha and Gbeta subunit isoforms by measuring changes in FRET between Gialpha-yellow fluorescent protein and cyan fluorescent protein-Gbeta chimeras in HeLa cells. All combinations of Gialpha1, -2, or -3 with Gbeta1, -2, or -4 were activated to some degree by endogenous alpha2Rs as judged by agonist-dependent decreases in FRET. The degree of G protein activation is determined by the combination of Gialpha and Gbeta subunits rather than by the identity of an individual subunit. RT-PCR analysis and small interfering RNA knockdown of alpha2R subtypes, followed by quantification of radiolabeled antagonist binding, demonstrated that HeLa cells express alpha2a- and alpha2b-adrenergic receptor isoforms in a 2:1 ratio. Increasing receptor number by overexpression of the alpha2aR subtype minimized the differences among coupling preferences for Gialpha and Gbeta isoforms. The molecular properties of each Gialpha, Gbeta, and alpha2-adrenergic receptor subtype influence signaling efficiency for the alpha2-adrenergic receptor-mediated signaling pathway.


Figures

Fig. 1.
Fig. 1.
Nucleotide exchange properties of Giα1-YFP chimeras. Uncatalyzed nucleotide exchange rates for H6-Giα1 (open circles), H6-Giα1(αb–αc)-YFP (open triangles), and H6-Giα1(αa–αb)-YFP (filled squares) were determined by measuring binding of [35S]GTPγS at 30°C. Data are presented as percentage of the maximal amount of [35S]GTPγS bound. Solid lines are single exponential fits to the data.
Fig. 2.
Fig. 2.
Membrane localization of CFP-β1, Giα1-YFP, and their corresponding FRETc signal. CFP, YFP, and FRET images were acquired at 2 × 2 pixel binning with a 63 × 1.4 numerical aperture objective 30 h after transfection of cDNAs encoding the chimeric proteins. FRETc was calculated as described. Background has been subtracted from all images.
Fig. 3.
Fig. 3.
Time course of agonist-dependent change in FRETc between Giα1-YFP and CFP-β1. FRETc was monitored for 500 s. After the 129-s measurement, endogenous α2Rs were activated by addition of 1 μM UK14304. Yohimbine (20 μM) was added after the 281-s measurement. FRET exposure time was 350 ms. (A) Pseudocolored FRETc images before and after agonist and antagonist treatments. Images taken at 129 and 137 s have been scaled from 75 to 450 to illustrate the loss in FRETc upon addition of UK14304. Because of photobleaching, the 281- and 329-s images are scaled from 50 to 350 to show the recovery of FRETc after addition of antagonist. (B) Average FRETc pixel intensities for the entire cell in A over the complete time course. The dotted line is the single exponential fit to points 2–17 used to approximate photobleaching during the measurement. (C) Photobleach-corrected time course produced by removing exponential decay from data in B.
Fig. 4.
Fig. 4.
Linear relationship between Giα–Gβ activation and concentration. Changes in FRETc (ΔFRETc) after addition of UK14304 are plotted against FRETc intensities before treatment to monitor the interactions of Giα1-YFP (squares), Giα2-YFP (triangles), and Giα3-YFP (circles) with CFP-β2. All FRETc and ΔFRETc values have been normalized to 100-ms exposure times. Solid lines are linear fits to each data set with the y intercept fixed to zero.
Fig. 5.
Fig. 5.
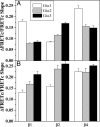
Fractional activation for all Giα–Gβ combinations. Slopes from linear fits of ΔFRETc vs. FRETc plots for all data sets are shown with their standard error. Values for Giα1, Giα2, and Giα3 are grouped according to their corresponding Gβ partners. Values are shown for activation by endogenous α2Rs (A) and overexpressed α2aR (B).
Fig. 6.
Fig. 6.
Overexpression of α2R subtypes. (A) Dependence on α2R subtype for activation of Giα1-YFP·CFP-β1 determined by the slopes from ΔFRETc vs. FRETc plots. (B) Level of expression of each receptor subtype based on [3H]RX821002 binding.
Fig. 7.
Fig. 7.
siRNA knockdown of α2R subtypes. HeLa cells were transfected with siRNA duplexes targeted at α2R subtypes a+b+c, a+b, a+c, and b+c as described in Experimental Procedures. The amount of receptor remaining following knockdown by each siRNA duplex was quantified by [3H]RX821002 binding.

References

    1. Kleuss, C., Scherubl, H., Hescheler, J., Schultz, G. & Wittig, B. (1993) Science 259, 832–834. - PubMed
    1. Kleuss, C., Scherubl, H., Hescheler, J., Schultz, G. & Wittig, B. (1992) Nature 358, 424–426. - PubMed
    1. Kleuss, C., Hescheler, J., Ewel, C., Rosenthal, W., Schultz, G. & Wittig, B. (1991) Nature 353, 43–48. - PubMed
    1. Albert, P. R. & Robillard, L. (2002) Cell Signal. 14, 407–418. - PubMed
    1. Robishaw, J. D. & Berlot, C. H. (2004) Curr. Opin. Cell Biol. 16, 206–209. - PubMed

Publication types

MeSH terms

Substances

LinkOut - more resources