. 2006 Mar;17(3):1239-49.
doi: 10.1091/mbc.e05-10-0952. Epub 2005 Dec 21.

Rapid, diffusional shuttling of poly(A) RNA between nuclear speckles and the nucleoplasm

Affiliations

Rapid, diffusional shuttling of poly(A) RNA between nuclear speckles and the nucleoplasm

Joan C Ritland Politz et al. Mol Biol Cell. 2006 Mar.

Abstract

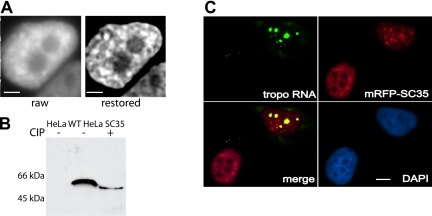
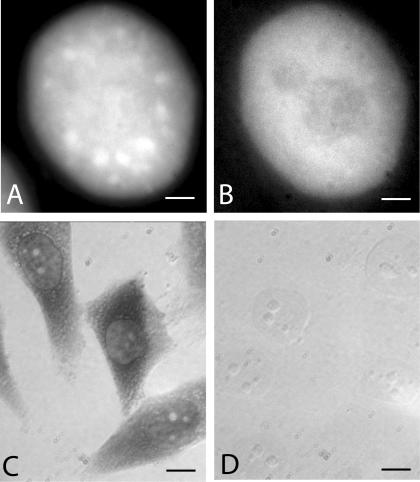
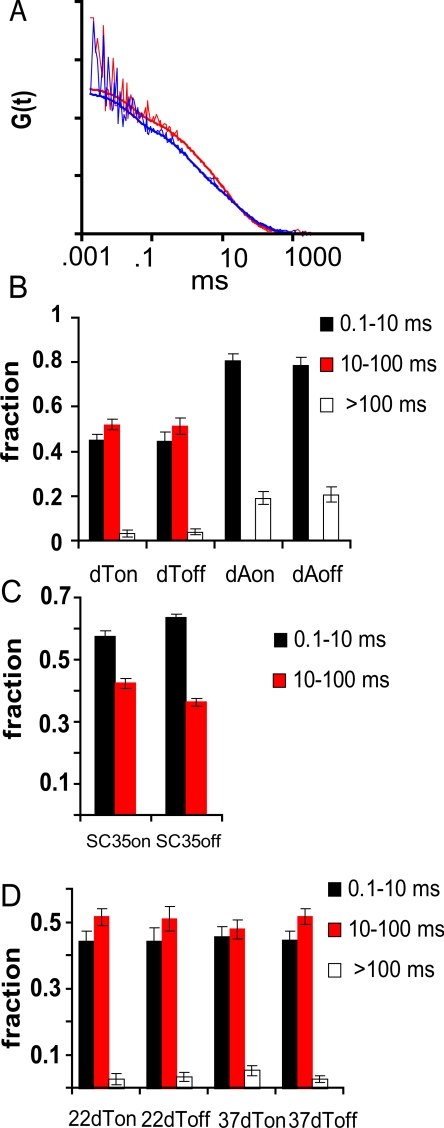
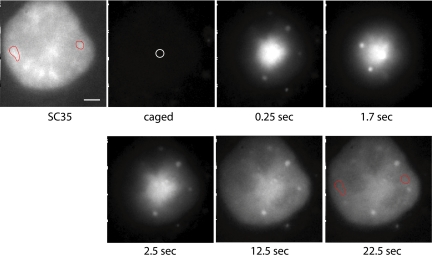
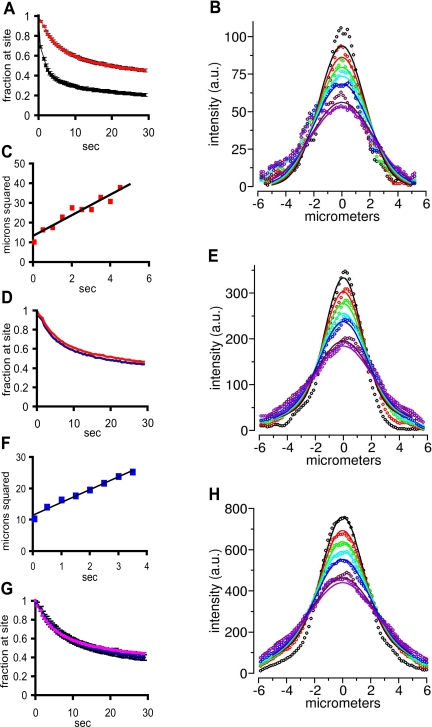
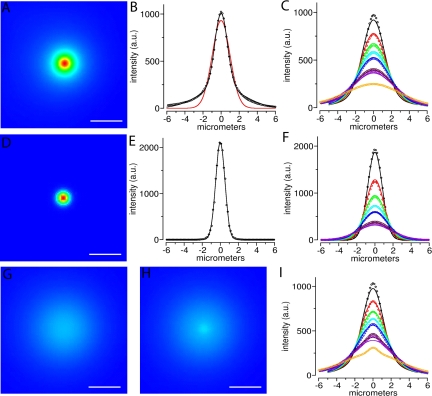
Speckles are nuclear bodies that contain pre-mRNA splicing factors and polyadenylated RNA. Because nuclear poly(A) RNA consists of both mRNA transcripts and nucleus-restricted RNAs, we tested whether poly(A) RNA in speckles is dynamic or rather an immobile, perhaps structural, component. Fluorescein-labeled oligo(dT) was introduced into HeLa cells stably expressing a red fluorescent protein chimera of the splicing factor SC35 and allowed to hybridize. Fluorescence correlation spectroscopy (FCS) showed that the mobility of the tagged poly(A) RNA was virtually identical in both speckles and at random nucleoplasmic sites. This same result was observed in photoactivation-tracking studies in which caged fluorescein-labeled oligo(dT) was used as hybridization probe, and the rate of movement away from either a speckle or nucleoplasmic site was monitored using digital imaging microscopy after photoactivation. Furthermore, the tagged poly(A) RNA was observed to rapidly distribute throughout the entire nucleoplasm and other speckles, regardless of whether the tracking observations were initiated in a speckle or the nucleoplasm. Finally, in both FCS and photoactivation-tracking studies, a temperature reduction from 37 to 22 degrees C had no discernible effect on the behavior of poly(A) RNA in either speckles or the nucleoplasm, strongly suggesting that its movement in and out of speckles does not require metabolic energy.


Figures

Figure 1.
Figure 1.
Characteristics of HeLa cell line stably expressing mRFP-SC35. (A) Raw and restored (exhaustive photon reassignment; see Materials and Methods) midplanes of an optical stack showing a live HeLa cell stably expressing mRFP-SC35. Bars, 4.2 μm. (B) Immunoblot of total cellular proteins probed with RFP antibody before (–) and after (+) treatment with CIP in wild-type HeLa cells (left lane) and the stable SC35 HeLa cell line (middle and right lanes). (C) Fluorescent in situ hybridization to fixed SC35 stable HeLa cell line transiently transfected with a plasmid that expresses β-tropomyosin mRNA at high levels (see Materials and Methods). β-Tropomyosin mRNA was detected with a Spectrum-Green-labeled probe (green) and overlap with mRFP-SC35 (red) is shown as yellow. Bar, 5 μm.
Figure 2.
Figure 2.
In vivo signal distribution and in situ reverse transcription in the mRFP-SC35 HeLa cell line after uptake of fl-oligo(dT) or fl-oligo(dA). (A and B) HeLa cells stably transfected with SC35-mRFP were allowed to take up fluorescently labeled oligo(dT) and the distribution of signal was visualized as described in Materials and Methods. (A) SC35-mRFP. (B) fl-oligo(dT). Bars, 3 μm. (C and D) After uptake of either fl-oligo(dT) or fl-oligo(dA), cells were fixed and subjected to in situ reverse transcription as described in Materials and Methods. Incorporation of biotin-labeled deoxynucleotides was detected using anti-biotin antibody coupled to horseradish peroxidase as described in text. (C) Bright field image of cells containing oligo(dT). (D) Bright field image of cells containing oligo(dA). Bars, 9.4 μm.
Figure 3.
Figure 3.
Mobility of oligo(dT) and oligo(dA) on and off speckles in mRFP-SC35 HeLa cells measured using FCS. (A) Autocorrelation curves of cells containing oligo(dT), based on FCS measured either within a speckle (blue) or in the nucleoplasm (off a speckle, red). (B) Fraction of oligo(dT) and oligo(dA) present in different mobility classes measured within speckles (on) and in the nucleoplasm (off). Each kinetic component is indicated by black, red, or open bars in the histogram. The 10- to 100-ms component (red) was undetectable in oligo(dA) containing-cells. (C) Fraction of mRFP-SC35 protein present in different mobility classes measured within speckles (on) and in the nucleoplasm (off). (D) Average fraction of oligo(dT) present in different mobility classes measured using FCS within speckles (on) and in the nucleoplasm (off) at 22 and 37°C.
Figure 4.
Figure 4.
Movement of oligo(dT):poly(A) RNA hybrids away from a speckle after photoactivation. mRFP-SC35 HeLa cells were allowed to take up caged-fl oligo(dT) and then the probe was photoactivated using 360-nm light directed at a speckle in a live cell nucleus as described in Materials and Methods. The uncaging site is marked with a white circle in the “caged” panel, and two speckles are circled in red in both the SC35 panel and in the final panel. High-speed time-lapse digital image microscopy was used to capture 2D images of the signal as it moved away from the uncaging site. (The brighter dots visualized here sometimes occur in cells that have taken up oligodeoxynucleotides and do not correspond to hybridization sites (Politz and Pederson, unpublished data; also see Lorenz et al., 1998). Bar, 2.6 μm.
Figure 5.
Figure 5.
Characterization of signal movement away from photoactivation site. (A) Probe was uncaged in speckles in cells containing either oligo(dT) (red curve) or oligo(dA) (black curve) and the average signal/pixel remaining at the uncaging site (bleach adjusted) was calculated for each time point and plotted. The bar on each time point represents the SE of the mean. (B) The Gaussian distributions of the signal intensity across a line across the nucleus and through the center of the uncaging site were digitally recorded at successive times after photoactivation (broken curves, top to bottom, 65, 450, 900, 1350, 1800, 3150, and 3500 ms), and a global algorithm was used to determine the best fit diffusion coefficient for the curves and time simultaneously (see Figure 6; see Materials and Methods). A representative distribution and the simulated fit (smooth lines) for an uncaging on a speckle is shown here; the diffusion coefficient estimated from this uncaging was 0.346 μm2/s. (C) The mean square displacement (at e–2) versus time plotted for the same uncaging site as shown in B. The line through the points is based on a linear least squares regression analysis (R2 = 0.92) and predicts a diffusion coefficient of 0.7 μm2/s. (D) Average signal remaining at uncaging sites over time after uncaging on (red curve) or off (blue curve) a speckle in cells containing oligo(dT). Error bars for each point have been omitted so that the two curves can be seen clearly. For each point the SE of the mean was less than or equal to ±3%. (E) Same as in B except the uncaging site was nucleoplasmic (off a speckle). The diffusion coefficient calculated from this global fit is 0.285 μm2/s. (F) The mean square displacement (at e–2) versus time plotted for the same uncaging site as shown in E. (D = 0.6 μm2/s; R2 = 0.98). (G) Average fraction of signal remaining at uncaging site after photoactivation of caged-fl oligo(dT) in speckles at 37°C (pink) and 22°C (blue). The bar on each point is the SE of the mean. (H) Same as B except at 22°C. The diffusion coefficient estimated from this global fit is 0.351 μm2/s.
Figure 6.
Figure 6.
Simulations of a population of molecules moving away from a one micron diameter uncaging site with a diffusion coefficient of 0.3 μm2/s. (A) Simulated (see Materials and Methods) wide-field microscope image of the uncaged spot before any diffusion has occurred. The uncaged profile is reimaged with both in-focus (the aperture) and out-of-focus components. (B) Plot of intensities along a line through the center of the spot in A (circles), are well fit by a two component Gaussian model (black line) compared with a single Gaussian model (red line). The two Gaussian components capture the in-focus (narrower) and out-of-focus (broader) contributions (see Materials and Methods). (C) Plot of intensities along the same line over time, after allowing the initial uncaged distribution shown in A and B to diffuse in 3-D with D = 0.3 μm2/s. Colors (black, red, green, cyan, blue, magenta, violet, and orange) correspond to data from images at times 0.15, 0.6, 1.05, 1.5, 1.95 (2.4 and 2.85 not shown), 3.3, 3.75, and 8.25 s, respectively. The intensity line data from the images up to 3.75 s were jointly fit with the equation for a single (Gaussian) diffusion component convolved with a two Gaussian component initial uncaged distribution (solid lines). The diffusion coefficient from the fit was D = 0.38 μm2/s. (D) Same as in A except before being reimaged (blurred) by the PSF of the microscope. This yields only the infocus portion of the 3-D uncaged spot. (E) Plot of intensities along a line through the center of D (circles) are well fit by a one-component gaussian model (black line). (F) Same as C except the lines were through D, and the equation fit to the data is a single diffusion component convolved with a single Gaussian component for the initial distribution. From the fit, D = 0.34 μm2/s. (G) From the same simulation as in A, after diffusing for 8.25 s (orange circles in C). (H) Same as in G except for this simulation, 5% of the uncaged molecules at the uncaging spot were assumed to be immobile. (I) Same as C, but the line was drawn through the center of the uncaging site on H. The presence of the 5% fixed molecules within a 2 μm speckle is quite evident by 8 s (orange circles, compare with C). Bars (A, C, F and G), 4 μm.

Similar articles

Cited by

References

    1. Bubulya, P. A., and Spector, D. L. (2004). “On the move”ments of nuclear components in living cells. Exp. Cell Res. 296, 4–11. - PubMed
    1. Calapez, A., Pereira, H. M., Calado, A., Braga, J., Rino, J., Carvalho, C., Tavanez, J. P., Wahle, E., Rosa, A. C., and Carmo-Fonseca, M. (2002). The intranuclear mobility of messenger RNA binding proteins is ATP dependent and temperature sensitive. J. Cell Biol. 159, 795–805. - PMC - PubMed
    1. Campbell, R. E., Tour, O., Palmer, A. E., Steinbach, P. A., Baird, G. S., Zacharias, D. A., and Tsien, R. Y. (2002). A monomeric red fluorescent protein. Proc. Natl. Acad. Sci. USA 11, 7877–7882. - PMC - PubMed
    1. Cardullo, R. A., Mungovan, R. M., and Wolf, D. E. (1991). Imaging membrane organization and dynamics. In: Biophysical and Biochemical Aspects of Fluorescence Spectroscopy, ed. T. D. Dewey, New York: Plenum Publishing, 231–260.
    1. Carrington, W. A., Lynch, R. M., Moore, E. D., Isenberg, G., Fogarty, K. E., and Fay, F. S. (1995). Superresolution three-dimensional images of fluorescence in cells with minimal light exposure. Science 268, 1483–1487. - PubMed

Publication types

LinkOut - more resources