Review
. 2006 Jan;86(1):25-88.
doi: 10.1152/physrev.00023.2005.

Calcium at fertilization and in early development

Affiliations
Review

Calcium at fertilization and in early development

Michael Whitaker. Physiol Rev. 2006 Jan.

Abstract

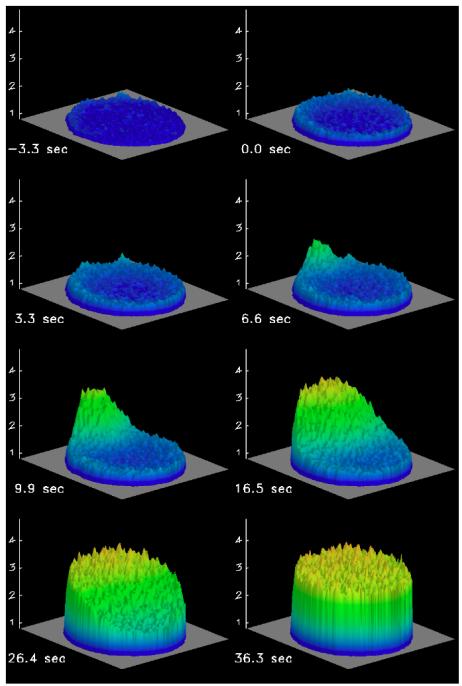
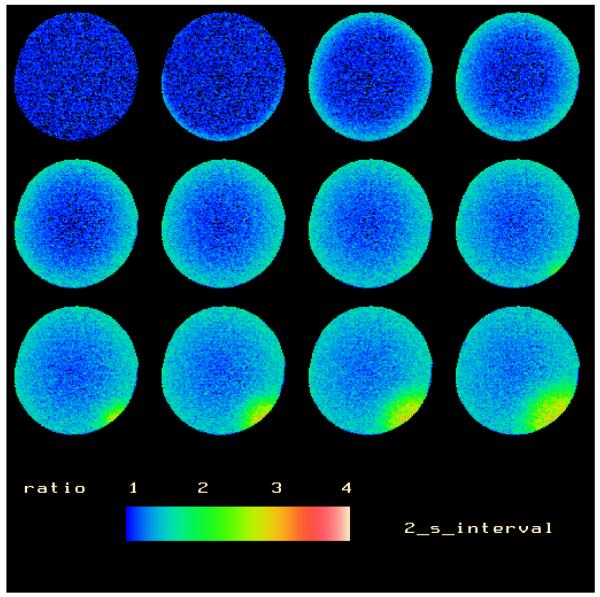
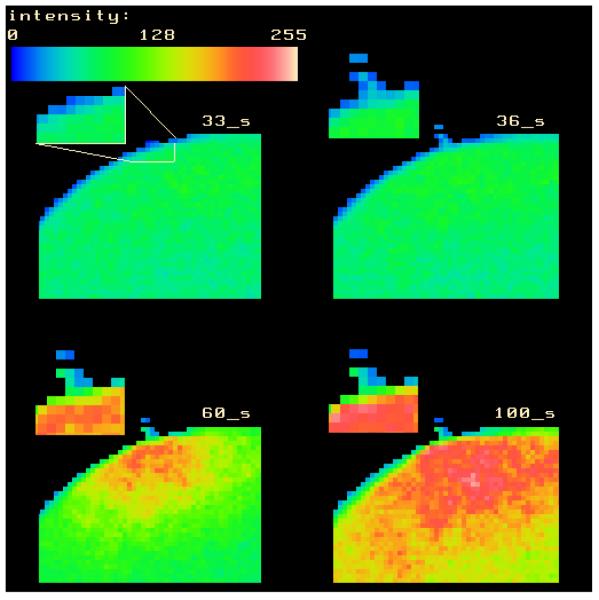
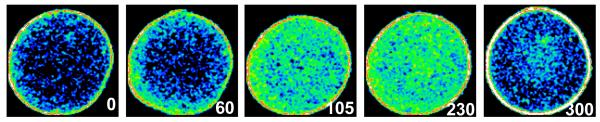
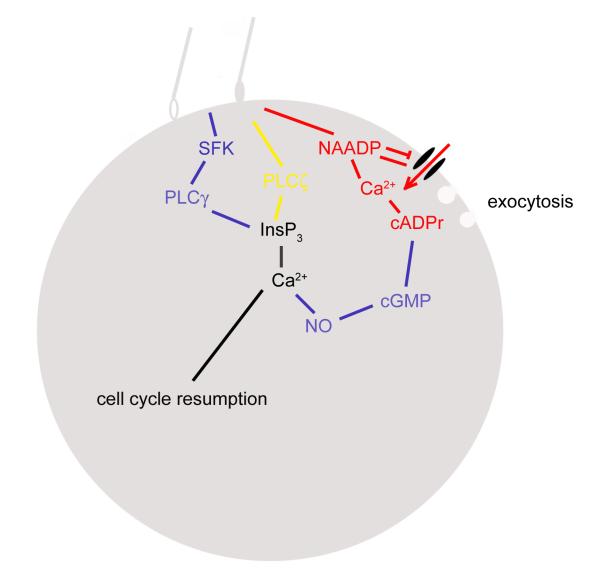
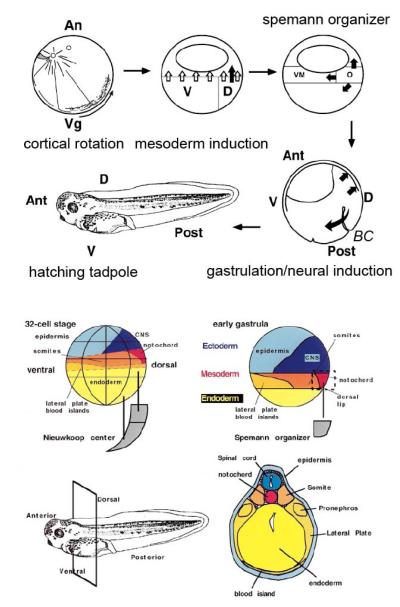
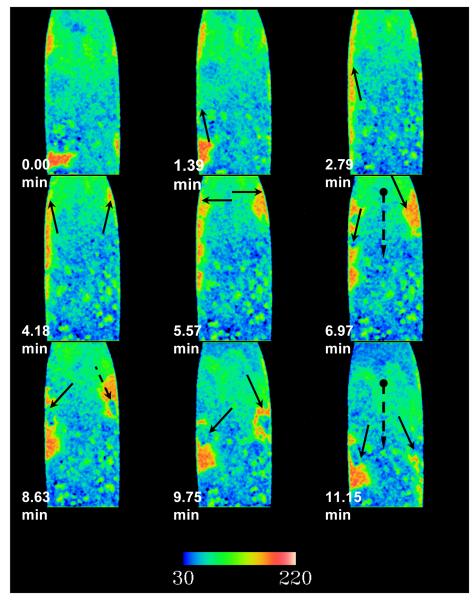
Fertilization calcium waves are introduced, and the evidence from which we can infer general mechanisms of these waves is presented. The two main classes of hypotheses put forward to explain the generation of the fertilization calcium wave are set out, and it is concluded that initiation of the fertilization calcium wave can be most generally explained in invertebrates by a mechanism in which an activating substance enters the egg from the sperm on sperm-egg fusion, activating the egg by stimulating phospholipase C activation through a src family kinase pathway and in mammals by the diffusion of a sperm-specific phospholipase C from sperm to egg on sperm-egg fusion. The fertilization calcium wave is then set into the context of cell cycle control, and the mechanism of repetitive calcium spiking in mammalian eggs is investigated. Evidence that calcium signals control cell division in early embryos is reviewed, and it is concluded that calcium signals are essential at all three stages of cell division in early embryos. Evidence that phosphoinositide signaling pathways control the resumption of meiosis during oocyte maturation is considered. It is concluded on balance that the evidence points to a need for phosphoinositide/calcium signaling during resumption of meiosis. Changes to the calcium signaling machinery occur during meiosis to enable the production of a calcium wave in the mature oocyte when it is fertilized; evidence that the shape and structure of the endoplasmic reticulum alters dynamically during maturation and after fertilization is reviewed, and the link between ER dynamics and the cytoskeleton is discussed. There is evidence that calcium signaling plays a key part in the development of patterning in early embryos. Morphogenesis in ascidian, frog, and zebrafish embryos is briefly described to provide the developmental context in which calcium signals act. Intracellular calcium waves that may play a role in axis formation in ascidian are discussed. Evidence that the Wingless/calcium signaling pathway is a strong ventralizing signal in Xenopus, mediated by phosphoinositide signaling, is adumbrated. The central role that calcium channels play in morphogenetic movements during gastrulation and in ectodermal and mesodermal gene expression during late gastrulation is demonstrated. Experiments in zebrafish provide a strong indication that calcium signals are essential for pattern formation and organogenesis.


Figures

Figure 1
Figure 1
The fertilization calcium wave in a sea urchin (Lytechinus pictus) egg. The calcium wave initiates at the point of sperm entry and crosses the egg as a tsunami-like wave, traversing the egg in around 20s. Calcium concentrations were visualized using the calcium indicator calcium green dextran and confocal microscopy. Calcium levels are represented by warm colours and height in this topographical plot. A pseudoratio image is generated by pixelwise division of each image by an image of resting dye distribution acquired before fertilization. Adapted from reference 360.
Figure 2
Figure 2
The action potential and latent period at fertilization. Relatively rapid confocal scanning microscopy reveals the action potential as a small elevation of calcium just beneath the plasma membrane. Images read as one reads text, from left to right and top to bottom. The second image shows the rapid influx: it occurs about halfway through the confocal scan, giving rise to an image that appears to show influx in only the bottom half of the image. Careful inspection will show that this subcortical calcium increase is also present in Figure 1 at the point of fertilization. The latent period is the time between the action potential and the initiation of the calcium wave in image 8 and is around 15s long. During this period no change in cytoplasmic calcium concentration is detectable. Methods as for Figure 1. Originally published in reference 538.
Figure 3
Figure 3
Sperm egg fusion. Sperm egg fusion can be detected through the transfer of calcium green dye from egg to sperm. The data demonstrate that sperm egg fusion occurs before calcium concentrations increase at the site of fusion and the calcium wave is initiated. Methods as for Figure 1. Adapted from reference 538.
Figure 4
Figure 4
InsP3 increases at fertilization. Images of a Lytechinus pictus egg microinjected with a PLCδ PH domain-green fluorescent protein chimera. As InsP3 is generated at fertilization, it competes for binding of the probe with plasma membrane PtdInsP2, causing the fluorescent probe to leave the plasma membrane and accumulate in the cytoplasm. As InsP3 levels fall, the probe leaves the cytoplasm and reaccumulates on the plasma membrane. Note the slow time course of this response relative to the release of calcium: because the diffusion constant of the protein chimera is perhaps 50-fold lower than that of InsP3, it is not a faithful spatiotemporal indicator of InsP3 increase, but can be used to estimate the maximal InsP3 concentrations at fertilization.
Figure 5
Figure 5
Signalling pathways at fertilization. In frog, ascidian and echinoderms, src family kinases (SFK) activate PLCγ to produce InsP3 and trigger the calcium waves (blue pathway); in sea urchin, there is good evidence that sperm-egg fusion is required for egg activation, but in frog this is less certain. In sea urchin, calcium activates nitric oxide production which generates cADPr via cGMP (blue pathway). In mammals, sperm-egg fusion introduces PLCζ into the egg cytoplasm, so producing InsP3 (yellow pathway). Sperm egg fusion may also introduce NAADP in echinoderms; NAADP activates plasma membrane calcium channels (red pathway). In ascidian, NAADP inactivates plasma membrane channels, while cADPr triggers local calcium release to trigger cortical granule exocytosis (red pathway).
Figure 6
Figure 6
Slow mitotic calcium waves in syncytial Drosophila embryos. Calcium waves move from pole to equator in Drosophila embryos, in step with mitotic waves. The calcium waves are subcortical, as are the embryo nuclei (not visible); the centre of a Drosophila embryo is a yolky mass. Ratiometric imaging using calcium green- and rhodamine-dextran. The images are displayed topographically, with small non-topographical images for comparison.
Figure 7
Figure 7
Calcium signals in the enveloping layer of zebrafish (Dania rerio) embryos during the blastodisc stage. Calcium transients occur sporadically in the enveloping layer. Two examples are shown of a common observation that transients are correlated in adjacent cells. Calcium green-/rhodamine-dextran confocal ratio imaging of a mid-blastula blastodisc viewed en face.
Figure 7
Figure 7
Calcium signals in the enveloping layer of zebrafish (Dania rerio) embryos during the blastodisc stage. Calcium transients occur sporadically in the enveloping layer. Two examples are shown of a common observation that transients are correlated in adjacent cells. Calcium green-/rhodamine-dextran confocal ratio imaging of a mid-blastula blastodisc viewed en face.
Figure 8
Figure 8
Calcium and calmodulin imaging during mitosis in sea urchin (Lytechinus pictus) embryos. Left hand images show calcium concentrations during mitosis, represented topographically. Right hand images show active calmodulin. Calcium increases at around 64 minutes after fertilization, leading to a local activation of calmodulin in the perinuclear region at 70 minutes as NEB occurs. A second increase in calcium at 86 min is associated with activation of calmodulin at the mitotic spindle poles just before anaphase. Note that the spatiotemporal pattern of calmodulin activation is determined by recruitment of active calmodulin to its targets. Calcium concentrations were measured by ratiometric imaging with calcium green- and rhodamine-dextran. Active calmodulin was imaged by ratiometric imaging of TA- and fluorescein calmodulin. TA-calmodulin senses calmodulin activation and concentration, while fluorescein-calmodulin senses concentration alone. Adapted from references 188 and .
Figure 9
Figure 9
Accumulation of endoplasmic reticulum around the nucleus and mitotic spindle during mitosis in sea urchin (Lytechinus pictus) and Drosophila embryos. Upper panel, sea urchin. The ER begins to accumulate as the nucleus elongates after centrosome duplication in prophase; ER increasingly accumulates around the spindle poles, but not the chromosomes throughout metaphase and anaphase. Lower panel, Drosophila. In these embryos, the spindle remains bounded by ER which does not enter the spindle. Nonetheless, ER accumulates around the ends of the spindle during metaphase and anaphase. In both cases, ER is visualized by injection of the lipophilic dye, Di(I)C16.
Figure 10
Figure 10
Calcium waves in ascidian oocytes at fertilization. A: the temporal sequence of calcium waves. There is a single large fertilization wave (1st phase), followed by seven equally spaced waves as the oocyte proceeds through the second meiotic division (2nd phase). B: The oocyte is fertilized by the sperm between four and five o’clock and the large fertilization wave sweeps across this 200 μm oocyte in around 40s. C: the consequence of the fertilization wave is a very marked cortical contraction that generates a nipple-like cortical protrusion called the contraction pole (arrow). D: the calcium waves of the second phase originate at the contraction pole; a single wave is illustrated. Ascidiella apersa. Reproduced from reference 65.
Figure 11
Figure 11
Pattern formation and cell fate in Xenopus embryos. ABOVE: cortical rotation involves a displacement of cortical cytoplasm directed along microtubules and specified by the growth of the sperm aster (An=animal pole, Vg=vegetal pole); mesoderm induction occurs in midblastula after around 12 cell divisions when a blastocoel has formed due to signaling from endoderm to ectoderm (V=ventral endoderm, D=dorsal endoderm, open arrows=general induction signal, closed arrow=dorsalizing induction signal from the Nieuwkoop centre); the Spemann organizer (O) emits local signals that induce neural tissues (up), dorsalize mesoderm (left, VM=ventral mesoderm) and anteriorize endoderm (down and left); during gastrulation mesoderm that has come to lie under dorsal extoderm as a consequence of gastrulation movements causes further neural induction (small double arrow), while dorsalization of mesoderm continues through signaling across BC, Brachet’s cleft (Ant=anterior, Post=posterior, D=dorsal, V=ventral); the axes of the hatching tadpole are illustrated. BELOW: fate map of early embryo with disposition of tissue illustrated in a cross section of a hatching tadpole. Xenopus laevis, adapted from Richard Harland and John Gerhart (202).
Figure 12
Figure 12
Localization of calcium pulses during gastrulation in Xenopus laevis. The point of origin of each calcium pulse is shown in A and line drawings constructed from video images of the same embryo are shown in B, with the area in which calcium pulses appear shown in red. The cross sections in C are from standard illustrations of Xenopus development. Calcium pulses are confined to dorsal ectoderm throughout gastrulation. Their frequency at different stages of development is shown in D. AC=animal cap, NIMZ=non-involuting marginal zone, IMZ=involuting marginal zone. Reproduced from reference 305.
Figure 13
Figure 13
Calcium signalling pathways during dorso-ventral specification in Xenopus laevis and zebrafish. Wnt regulated calcium signals promote ventral cell fates via G-protein transduction mechanisms and act through CaM kinaseII and calcineurin to upregulate ventral transcription factors and downregulate dorsal transcription factors; this pathway also downregulates dishevelled signalling via PKCβ, thus antagonizing the canonical dorsalizing Wnt pathway and stabilizing β-catenin ventrally. A second calcium signalling pathway operates to induce dorsal cell fates. It consists of calcium-channel mediated activation of calcineurin and requires FKBP12; it downregulates the ventralizing BMP4 and TGFβ pathways.
Figure 14
Figure 14
Localization of calcium pulses during gastrulation in zebrafish. UPPER PANEL: the three classes of signal during gastrulation between 50 and 75% epiboly. a-c: three examples of the persistent ventral signal in three difference embryos from three different points of view, shown superimposed on bright field images (d-f). g: yolk flash. h,i: marginal hotspots. L=left, R=right, D=dorsal, V=ventral, HS=hot spots. LOWER PANEL: a,b marginal waves originate from the dorsal midline pacemaker (PM) both unidirectionally and bidirectionally. c tailbud waves. Reproduced from reference 172.
Figure 15
Figure 15
Calcium and the nodal flow hypothesis of left-right axis determination. A: Hensen’s node is a shallow depression lined with cilia. Central cilia express both dynein and polycystin-2 and are motile (green). Peripheral cilia express only polycystin-2 and are immotile, with a sensory function (red). At this stage nodal expression shows bilateral symmetry. B: Right to left flow induced by the chiral beating of the motile cilia stimulates a calcium increase in left peripheral sensory cilia, leading to asymmetric expression of nodal. Reproduced from reference 361.
Figure 16
Figure 16
Calcium waves of unknown function during Drosophila development. Calcium waves recorded on the ventral aspect on a Bownes stage 9 embryo. Waves move at a velocity of around 2 μm.s-1 both anteriorly (0-5min) and posteriorly (5-11 min). The calcium waves are approximately symmetric across the ventral midline and appear to be excluded from specific regions of the embryo (dashed arrow). Waves were visualized using ratiometric confocal fluorescence imaging using calcium green- and rhodamine-dextran. Warm colours represent areas of higher calcium concentration.

References

    1. Aanstad P, Whitaker M. Predictability of dorso-ventral asymmetry in the cleavage stage zebrafish embryo: an analysis using lithium sensitivity as a dorso-ventral marker. Mech Dev. 1999;88:33–41. - PubMed
    1. Aarhus R, Dickey DM, Graeff RM, Gee KR, Walseth TF, Lee HC. Activation and inactivation of Ca2+ release by NAADP+ J Biol Chem. 1996;271:8513–8516. - PubMed
    1. Aarhus R, Graeff RM, Dickey DM, Walseth TF, Lee HC. ADP-ribosyl cyclase and CD38 catalyze the synthesis of a calcium-mobilizing metabolite from NADP. 1995;270:30327–30333. - PubMed
    1. Abassi YA, Carroll DJ, Giusti AF, Belton RJ, Foltz KR. Evidence that Src-type tyrosine kinase activity is necessary for initiation of calcium release at fertilization in sea urchin eggs. Dev Biol. 2000;218:206–219. - PubMed
    1. Abassi YA, Foltz KR. Tyrosine phosphorylation of the egg receptor for sperm at fertilization. Dev Biol. 1994;164:430–443. - PubMed

Publication types

LinkOut - more resources