. 2006 Jul;27(7):572-87.
doi: 10.1002/hbm.20202.

Affective judgment and beneficial decision making: ventromedial prefrontal activity correlates with performance in the Iowa Gambling Task

Affiliations

Affective judgment and beneficial decision making: ventromedial prefrontal activity correlates with performance in the Iowa Gambling Task

Georg Northoff et al. Hum Brain Mapp. 2006 Jul.

Abstract

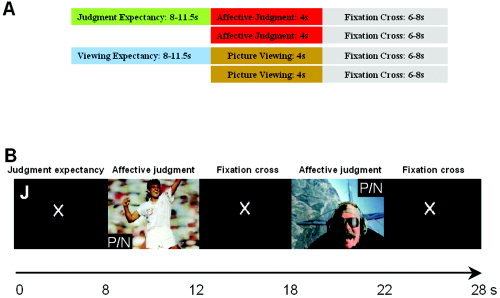
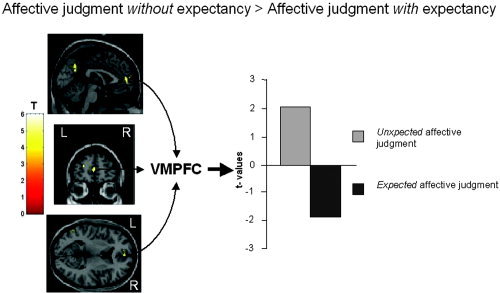
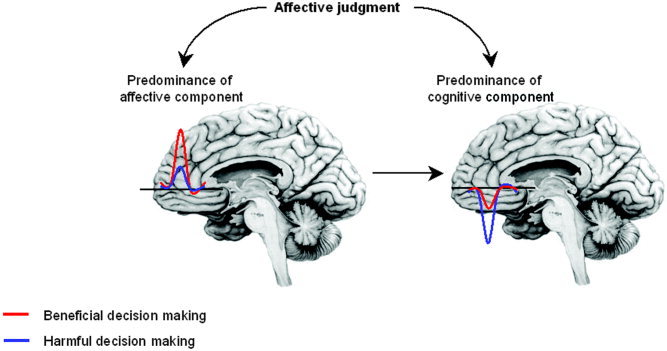
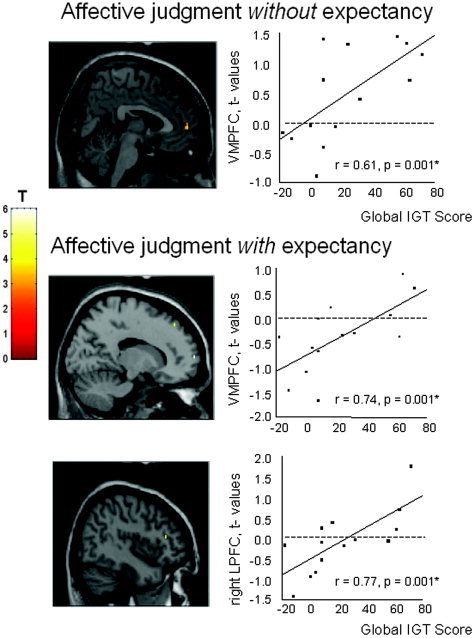
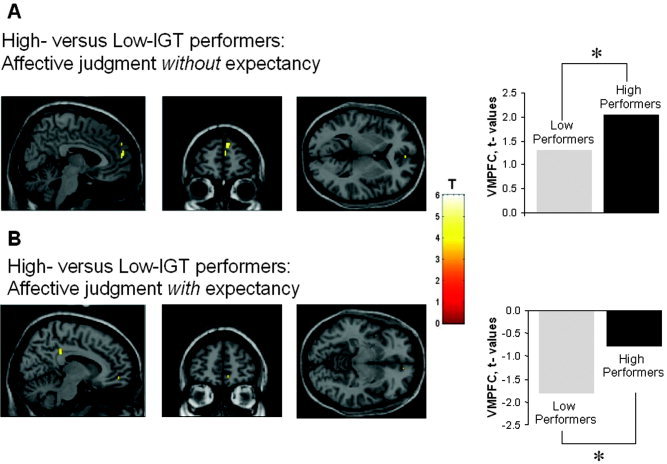
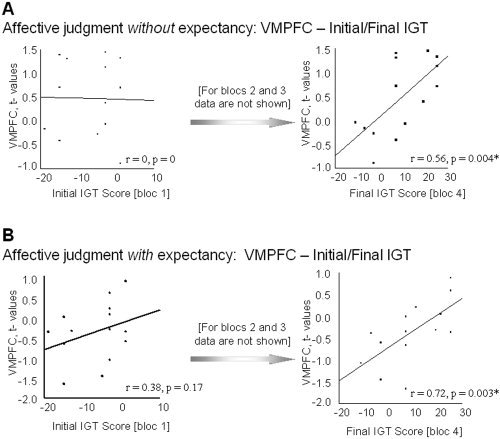
Damasio proposes in his somatic marker theory that not only cognitive but also affective components are critical for decision making. Since affective judgment requires an interplay between affective and cognitive components, it might be considered a key process in decision making that has been linked to neural activity in ventromedial prefrontal cortex (VMPFC). Using functional magnetic resonance imaging (fMRI), we examined the relationship between VMPFC, emotionally (unexpected)- and cognitively (expected)-accentuated affective judgment, and beneficial decision making (Iowa Gambling Task; IGT) in healthy subjects. Neuronal activity in the VMPFC during unexpected affective judgment significantly correlated with both global and final performance in the IGT task. These findings suggest that the degree to which subjects recruit the VMPFC during affective judgment is related to beneficial performance in decision making in gambling.


Figures

Figure 1
Figure 1
Activation paradigm for affective judgment with and without expectancy. A: Main conditions and control conditions. Affective judgment: judgment (positive/negative; P/N) of emotional pictures taken from the International Affective Picture System (IAPS) for a duration of 4 s. Response was given by button click. Affective judgment with expectancy: presentation and judgment of emotional picture were preceded by an expectancy period of 8–11.5 s (8.0, 8.5, 9.0, 9.5, 10.0, 10.5, 11.0, and 11.5 s). Fixation cross: presentation of a fixation cross for variable durations (6.0, 6.5, 7.0, 7.5, and 8.0 s), which served as baseline. Picture viewing: viewing of emotional pictures (A/B) taken from the IAPS for a duration of 4 s. Response was given by arbitrary button click. Picture viewing with expectancy: presentation and viewing of emotional picture were preceded by an expectancy period of 8–11.5 s (8.0, 8.5, 9.0, 9.5, 10.0, 10.5, 11.0, and 11.5 s). B: Affective judgment with and without preceding expectancy. The two main conditions affective judgment with and without preceding expectancy are schematically illustrated on a time scale. The single trials of both main conditions were randomly interspersed with trials from both control conditions, picture viewing with and without expectancy. [Color figure can be viewed in the online issue, which is available at www.interscience.wiley.com.]
Figure 2
Figure 2
Comparison between affective judgment without and with expectancy. Signal changes in the contrast affective judgment without expectancy > affective judgment with expectancy are demonstrated in the images on the left side. Signal increases are observed in the ventromedial prefrontal cortex (VMPFC; x = 0, y = 54, z = 8; Z = 3.73) and the precuneus (x = −8, y = −54, z = 28; Z = 3.26) during unexpected affective judgment compared to expected affective judgment. MNI coordinates given by x, y, z (in mm). All sagittal images represent the right hemisphere. Bars in the figure on the right side represent the mean t‐values in VMPFC calculated for each of the two main conditions to baseline. The region of interest (ROI) was drawn based on the contrast “affective judgment without expectancy > affective judgment with expectancy.” Accordingly, the ROI precisely reflect the blood oxygenation level‐dependent (BOLD) signals depicted in the images on the left. Signal increases in VMPFC during affective judgment without expectancy are reversed to signal decreases (as compared to baseline) when the affective judgment is preceded by an expectancy period. This functional mechanism might be called modulation by reversal, which is schematically illustrated in Figure 6 in relation to high‐ and low‐risk behavior.
Figure 6
Figure 6
Schematic illustration of the interrelationship between affective judgment, cognitive modulation, ventromedial prefrontal cortex (VMPFC) activity, and decision making performance. Pronounced emotional engagement in affective judgments is associated with increased VMPFC activity. At the same time, higher VMPFC activity is associated with better decision‐making performance. One might therefore conclude that beneficial decision‐making depends on how strong a person involves affective judgments as associated with VMPFC activation. This figure does not depict specific values collected in our study but rather illustrates a functional mechanism underlying decision making, as derived from our results and previous studies.
Figure 3
Figure 3
Correlation between signal changes during affective judgment and global score in Iowa Gambling Task (IGT). The left row shows SPM images resulting from regression between signal changes during affective judgment and global IGT scores. Because we wanted to demonstrate correlation effects for affective judgment without and with expectancy separately, we correlated the respective baseline contrasts with IGT scores. Baseline contrasts refer to affective judgment without expectancy versus baseline and affective judgment with expectancy versus baseline. Exact coordinates of correlating regions are described in Table II. The right row shows the respective curves resulting from correlation between mean t‐values in the respective region of interest (ROI) and global IGT scores using Spearman correlation analysis. Quadrats in scatterplots represent relation between t‐values, as obtained in functional magnetic resonance imaging (fMRI) in the respective contrast, and global IGT scores in single subjects. Positive t‐values describe signal increases whereas negative t‐values reflect signal decreases. Correlation coefficient and P values are presented below. Correlation of affective judgment without expectancy with IGT scores concerned predominantly signal increases in ventromedial prefrontal cortex (VMPFC). In contrast, correlation of affective judgment with expectancy with IGT scores concerned predominantly signal decreases in VMPFC and dorsomedial prefrontal cortex (DMPFC) and partially signal increases in right lateral prefrontal cortex (LPFC). Only regions with Z > 3.26 (P < 0.001 uncorrected, voxel level; P < 0.05 corrected, cluster level) are described. All images shown represent group average. In fMRI images, areas of significant signal changes are shown as through projections onto representations of standard stereotaxic space in sagittal, coronal, and transverse projections. fMRI images represent results of group analyses for simple regression (global IGT score as regressor) depicted on standard MNI brain. All sagittal images represent the right hemisphere. Voxels shown in fMRI correlation images (simple regression), as shown on the left side, served for calculation of Spearman correlation represented in scatterplots on the right.
Figure 4
Figure 4
Comparison of signal changes during affective judgment between high‐ and low‐performers in Iowa Gambling Task (IGT). A: Comparison between high and low performers in affective judgment without expectancy. SPM images are shown on the left, the bar diagrams with the respective mean t‐values as obtained in region of interest (ROI) analysis are demonstrated on the right. High performers show significantly more signal increases in ventromedial prefrontal cortex (VMPFC) than do low performers during affective judgment without expectancy. B: Comparison between high and low performers in affective judgment with expectancy. SPM images are shown on the left, the bar diagrams with the respective mean t‐values as obtained in ROI analysis are demonstrated on the right. Low performers show significantly more signal decreases in VMPFC (more orbitofrontal and thus slightly lower than in A) and posterior cingulate (not shown in bar diagram) than do low performers during affective judgment with expectancy. Only regions with Z > 3.26 (P < 0.001 uncorrected, voxel level; P < 0.05 corrected, cluster level) are described. All images shown represent group average. In functional magnetic resonance imaging (fMRI), areas of significant signal changes are shown as through projections onto representations of standard stereotaxic space in sagittal, coronal, and transverse projections. fMRI images represent results of group analyses for two‐sample t‐test depicted on standard MNI brain. All sagittal images represent the right hemisphere. Voxels shown in fMRI images served for calculation of t‐values as represented in bar diagrams below.
Figure 5
Figure 5
Correlation between signal changes during affective judgment and initial and final global scores in Iowa Gambling Task (IGT). The figure shows the respective curves resulting from correlation between mean t‐values in the respective region of interest (ROI) and initial and final global IGT scores using Spearman correlation analysis. Quadrats in scatterplots represent relation between t‐values, as obtained in functional magnetic resonance imaging (fMRI) in the respective contrast, and global IGT scores in single subjects. Positive t‐values describe signal increases whereas negative t‐values reflect signal decreases. Correlation coefficient and P values are presented below. Exact coordinates of correlating regions are described in Table II. A: Correlation between affective judgment without expectancy versus baseline with initial and final global IGT scores. Correlation of affective judgment without expectancy versus baseline with initial IGT scores remained nonsignificant whereas it was significant with final IGT scores. Correlation with final IGT scores concerned predominantly signal increases in ventromedial prefrontal cortex (VMPFC). B: Correlation between affective judgment with expectancy versus baseline with initial and final global IGT scores. Correlation of affective judgment with expectancy versus baseline with initial IGT scores remained nonsignificant whereas it was significant with final IGT scores. Correlation with final IGT scores concerned predominantly signal decreases in VMPFC.

Similar articles

Cited by

References

    1. Adinoff B, Devous MD Sr, Cooper DB, Best SE, Chandler P, Harris T, Cervin CA, Cullum CM (2003): Resting regional cerebral blood flow and gambling task performance in cocaine‐dependent subjects and healthy comparison subjects. Am J Psychiatry 160: 1892–1894. - PubMed
    1. Akitsuki Y, Sugiura M, Watanabe J, Yamashita K, Sassa Y, Awata S, Matsuoka H, Maeda Y, Matsue Y, Fukuda H, Kawashima R (2003): Context‐dependent cortical activation in response to financial reward and penalty: an event‐related fMRI study. Neuroimage 19: 1674–1685. - PubMed
    1. Bark R, Dieckmann S, Bogerts B, Northoff G (2005): Deficit in decision making in catatonic and paranoid schizophrenia: an exploratory study. Psychiatric Res 34: 131–141. - PubMed
    1. Bar‐On R, Tranel D, Denburg NL, Bechara A (2003): Exploring the neurological substrate of emotional and social intelligence. Brain 126: 1790–1800. - PubMed
    1. Bechara A (2004): The role of emotion in decision‐making: evidence from neurological patients with orbitofrontal damage. Brain Cogn 55: 30–40. - PubMed

Publication types

MeSH terms