. 2006 Mar 1;571(Pt 2):287-302.
doi: 10.1113/jphysiol.2005.097741. Epub 2005 Dec 22.

Differential polyamine sensitivity in inwardly rectifying Kir2 potassium channels

Affiliations

Differential polyamine sensitivity in inwardly rectifying Kir2 potassium channels

Brian K Panama et al. J Physiol. .

Abstract

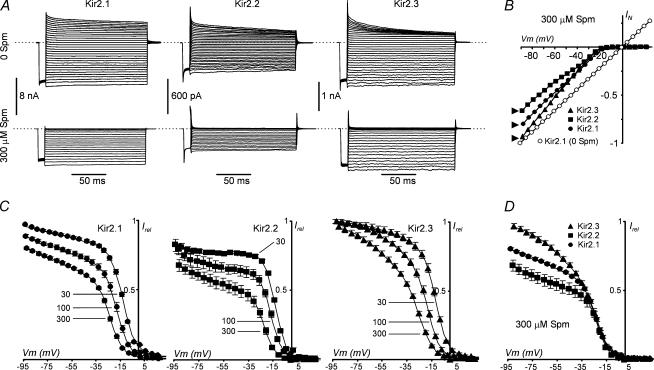
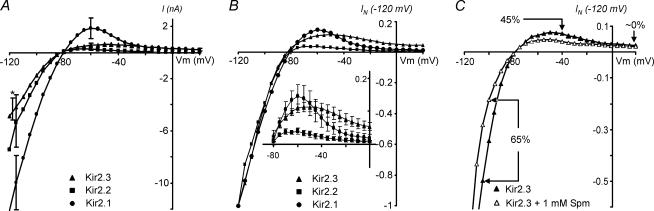
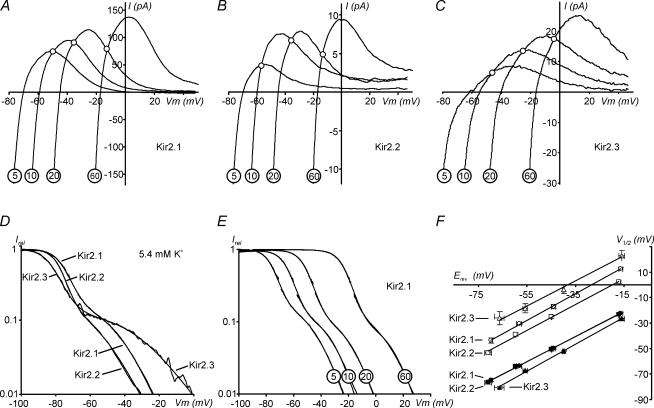
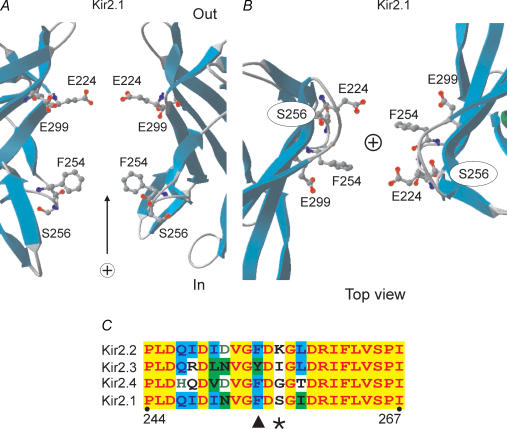
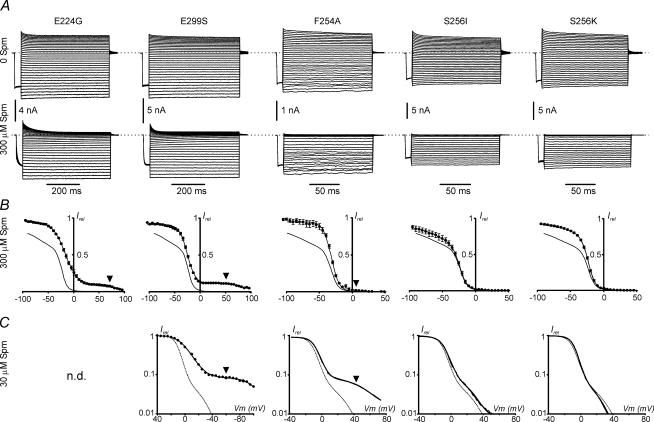
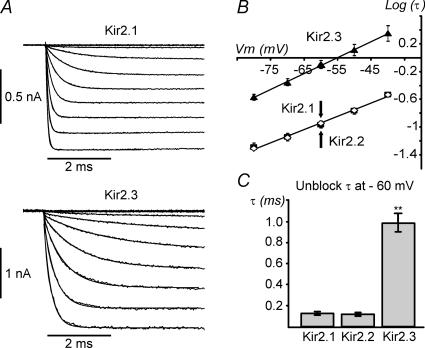
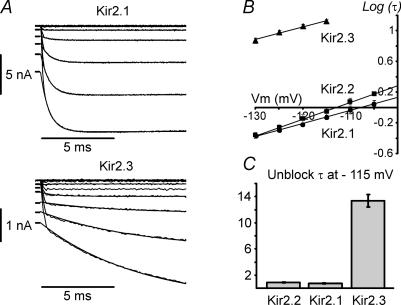
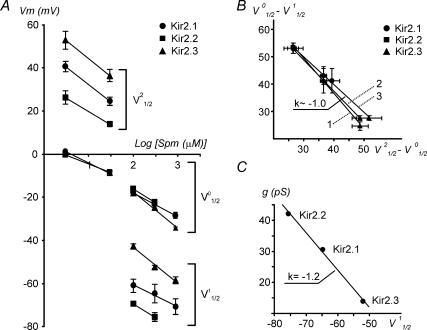
Recent studies have shown that Kir2 channels display differential sensitivity to intracellular polyamines, and have raised a number of questions about several properties of inward rectification important to the understanding of their physiological roles. In this study, we have carried out a detailed characterization of steady-state and kinetic properties of block of Kir2.1-3 channels by spermine. High-resolution recordings from outside-out patches showed that in all Kir2 channels current-voltage relationships display a 'crossover' effect upon change in extracellular K+. Experiments at different concentrations of spermine allowed for the characterization of two distinct shallow components of rectification, with the voltages for half-block negative (V1(1/2)) and positive (V2(1/2)) to the voltage of half-block for the major steep component of rectification (V0(1/2)). While V1(1/2) and V2(1/2) voltages differ significantly between Kir2 channels, they were coupled to each other according to the equation V1(1/2)-V2(1/2) = constant, strongly suggesting that similar structures may underlie both components. In Kir2.3 channels, the V2(1/2) was approximately 50 mV positive to V0(1/2), leading to a pattern of outward currents distinct from that of Kir2.1 and Kir2.2 channels. The effective valency of spermine block (Z0) was highest in Kir2.2 channels while the valencies in Kir2.1 and Kir2.3 channels were not significantly different. The voltage dependence of spermine unblock was similar in all Kir2 channels, but the rates of unblock were approximately 7-fold and approximately 16-fold slower in Kir2.3 channels than those in Kir2.1 and Kir2.2 when measured at high and physiological extracellular K+, respectively. In all Kir2 channels, the instantaneous phase of activation was present. The instantaneous phase was difficult to resolve at high extracellular K+ but it became evident and accounted for nearly 30-50% of the total current when recorded at physiological extracellular K+. In conclusion, the data are consistent with the universal mechanism of rectification in Kir2 channels, but also point to significant, and physiologically important, quantitative differences between Kir2 isoforms.


Figures

Figure 1
Figure 1. Differential spermine (Spm) sensitivity in Kir2 channels
Inside-out patches from HEK 293 cells expressing Kir2.1 (n = 7), Kir2.2 (n = 4) and Kir2.3 (n = 9) channels were exposed to Spm and high symmetrical [K+] (see Methods), and currents measured at the end of 150 ms voltage steps. A, representative current traces from Kir2.1-, Kir2.2- and Kir2.3-expressing cells recorded in 0 or 300 μm Spm in response to voltage steps to potentials between −90 and +60 mV preceded by 10 ms prepulse to −80 mV. Dashed lines indicate the zero current level. B, all channels showed strong inward rectification, with Kir2.3 blocked the least and Kir2.2 blocked the most at far negative potentials. Currents in the absence of Spm showed linear I–V relations at negative membrane potentials, and were assumed to be linear at positive potentials for all Kir2 channels. Residual rectification of varying degree remained even after careful PA washout but did not affect the results (see Methods). C, block by 30, 100 and 300 μm Spm was quantified by fitting relative currents with a double Boltzmann equation (see Methods). D, Kir2.1, 2.2 and 2.3 relative currents at 300 μm Spm are superimposed. The major differences between the Kir2 isoforms occurred at negative potentials.
Figure 2
Figure 2. Kir2 channels display differential rectification
A, averaged steady-state IV relationships for the Kir2.x isoforms were obtained in the whole-cell configuration with physiological (5.4 mm) extracellular K+ and without Spm in the pipette solution (KINT). s.e.m. bars are shown only at −120, −60 and +20 mV (not visible; overlaps with the symbol) for clarity. The error bar for Kir2.3 channels at −120 mV is also shifted for clarity (*). n = 5, 4 and 5 for Kir2.1, Kir2.2 and Kir2.3 channels, respectively. The data are not corrected off-line for voltage errors due to serial resistance remaining after compensation using the amplifier. B, currents in A were normalized at −120 mV. Inset shows expanded currents and corresponding error bars at an expanded current scale. Kir2.3 channels display ‘shallow’ rectification at depolarized potentials as well as a small but clear region of negative slope. C, Kir2.3 currents were recorded immediately after establishing whole-cell configuration (▴) and after 12 min of dialysis with 1 mm Spm (▵). IV relationships are normalized at −120 mV.
Figure 3
Figure 3. Extracellular K+ dependence of rectification in Kir2 channels
Kir2 currents were recorded in outside-out patches exposed to different extracellular K+ concentrations and in the presence of 30 μm total Spm in FVPP intracellular solution (see Methods). ‘5' corresponds to an actual value of 5.4 mm K+. A–C, representative currents recorded at 5.4, 10, 20 and 60 mm extracellular K+. Note different scale (absolute) for currents. D, an example of relative conductances for Kir2.1, Kir2.2 and Kir2.3 channels obtained at 5.4 mm extracellular K+. Original traces and the fits with Boltzmann functions overlap. A region of the data near the reversal potential (∼few mV) is omitted from fits. E, the K+ dependence of relative conductance in Kir2.1 channels. F, V01/2 and V21/2 voltages for half-block for the steep component and shallow component 2 of rectification, respectively, were measured at different K+ concentrations and plotted against corresponding reversal potentials. Filled and open symbols correspond to V01/2 and V21/2, respectively. Continuous lines are linear approximations to the data (8–12 measurements for each regression). The data and corresponding fits for V01/2 overlap for Kir2.1 and Kir2.2 channels. The data are from 2, 2 and 3 independent experiments for Kir2.1, Kir2.2 and Kir2.3, respectively.
Figure 4
Figure 4. Spermine dependence of shallow component 2
Representative records of Kir2 currents in inside-out patches at high symmetrical K+ exposed to 3 or 30 μm Spm in FVPP intracellular solution with pipettes filled with KINT solution (see Methods). Currents were recorded in response to 4 s voltage ramp, normalized at ∼−40 mV and fitted with the sum of two Boltzmann functions. A small region of the data near the reversal potential (a few mV) is omitted from fits. Fits overlap with the current traces and may not be visible in some places. The data are plotted on a log scale to highlight the shallow component 2.
Figure 5
Figure 5. Location of Kir2.1 mutations used in the study
A and B, crystal structure of C terminus of Kir2.1 channel (Pegan et al. 2005) was visualized using Swiss-PDB Viewer software. Two opposing subunits were removed for clarity and side chains for the mutants used in this study displayed. A represents a side view, and B shows a top view of the pore region. C, sequence alignment of Kir2 channels in the region around the residues critical for inward rectification. Arrowhead points to the highly conserved F254 residue and asterisk indicates the least conserved site in this region.
Figure 6
Figure 6. Rectification profiles of Kir2.1 mutants
A, representative current traces for Kir2.1 mutant channels were recorded in inside-out patches at high symmetrical K+ (see Methods) in the presence of 0 and 300 μm Spm. Note the larger time scale for E224G and E299S mutants where currents were recorded with longer voltage steps in order to accommodate slower kinetics of activation, and block at depolarized potentials. B, averaged steady-state relative currents at end of the test pulses (Irel) measured at 300 μm were fitted with a double Boltzmann equation (see Methods), with the exception of F254A that was fitted with a single Boltzmann equation. C, representative relative currents at 30 μm Spm are plotted at log scale to highlight shallow component 2. Due to slow kinetics in E224G and E299S mutants currents were measured at the end 600–800 ms test pulses, while the currents from faster gating F254A, S256I and S256K channels were recorded in response to slow voltage ramps (see Methods). In E224G mutant component 2 could not be fitted with confidence and thus was not determined (n.d.). B and C, fits to Kir2.1 Irel are shown for comparison with each mutant as a fine continuous curve. Arrowheads point to shallow component 2. n = 2–5 (Tables 3 and 4).
Figure 7
Figure 7. Differential kinetics of activation in Kir2 channels
A, representative inside-out current recordings from Kir2.1 and Kir2.3 channels in the presence of 300 μm Spm and high symmetrical [K+] (KINT; see Methods). Monoexponential fits to the time-dependent part of current traces are superimposed, but may not be seen due to overlapping. B, the activation τ for Kir2.x channels was obtained from current tracings as in A using a monoexponential fit and log values plotted against the membrane potential. Continuous lines represent a linear fit to the data. Note the log scale for τ. Kir2.1 and Kir2.2 channels display nearly identical activation times and voltage dependencies, Kir2.1 (▪) and Kir2.2 (⋄) symbols overlap (↑, ↓). Kir2.3 channels activate significantly more slowly and display similar voltage dependence of activation. C, at −60 mV Kir2.3 channels activate ∼7-fold slower than Kir2.1 and Kir2.2 channels. n = 8, 9 and 4 for Kir2.1, Kir2.2 and Kir2.3, respectively. Current activation was evoked using a series of hyperpolarizing steps from a Vh of +50 mV to potentials up to −80 mV.
Figure 8
Figure 8. Activation kinetics of Kir2 channels at physiological extracellular K+
A, representative whole-cell current recordings from Kir2.1 and Kir2.3 channels in the presence of 5.4 mm extracellular K+ and without Spm in the pipette solution (KINT). Dashes at the beginning of activation of Kir2.3 currents point to a quasi-instantaneous component of activation. Currents were recorded in response to voltage steps from −30 mV holding potential to potentials between −130 and −30 mV in 10 mV increments. Monoexponential fits to the time-dependent part of current traces are superimposed. B, activation τ values for Kir2.x channels were obtained from current tracings as in A using monoexponential fits and log values plotted against the membrane potential. Continuous lines represent a linear fit to the data. Note log scale for τ. C, Kir2.3 channels activate significantly more slowly and display voltage dependence of activation similar to Kir2.1 and Kir2.2 channels. At −115 mV Kir2.3 channels activate ∼16-fold slower than Kir2.1 and Kir2.2 channels. n = 4, 4 and 9 for Kir2.1, Kir2.2 and Kir2.3, respectively.
Figure 9
Figure 9. Spermine dependence of rectification, and relationships between parameters of rectification and single-channel conductance in Kir2 channels
A, voltages for half-block for components of rectification 0, 1 and 2 were derived from the fits to the data presented in Figs 1C and 4 and plotted against log[Spm] (log μm)]. B, the separation voltages for shallow components 1 and 2 in Kir2 channels measured at different concentrations of Spm are directly proportional to each other. Linear fits to the data correspond to: 1 = (100V01/2− 100V11/2)versus(30V21/2− 30V01/2), 2 = (300V01/2−300V11/2) versus (30V21/2− 30V01/2), and 3 = (300V01/2− 300V11/2) versus (3V21/2−3V01/2). For example, 300V21/2 means that the V21/2 component was measured at 300 μm Spm, etc. Since V01/2 is nearly the same for all channels at any specific [Spm] the relations translate to V21/2V11/2∼ constant. The V01/2V11/2 differences were derived from data in A and Table 1. At 3 μm Spm the V01/2 and V21/2 differences were obtained from inside-out patches (Fig. 4) only, and at 30 μm Spm the data are averages from Fig. 4 and Table 2 (outside-out patches). C, single-channel conductances of Kir channels (Liu et al. 2001) are plotted against V11/2, a voltage of half-block for the shallow component 1 of rectification.

Similar articles

Cited by

References

    1. Chang HK, Yeh SH, Shieh RC. A ring of negative charges in the intracellular vestibule of Kir2.1 channel modulates K+ permeation. Biophys J. 2005;88:243–254. - PMC - PubMed
    1. Dhamoon AS, Jalife J. The inward rectifier current (IK1) controls cardiac excitability and is involved in arrhythmogenesis. Heart Rhythm. 2005;2:316–324. - PubMed
    1. Dhamoon AS, Pandit SV, Sarmast F, Parisian KR, Guha P, Li Y, Bagwe S, Taffet SM, Anumonwo JM. Unique Kir2.x properties determine regional and species differences in the cardiac inward rectifier K+ current. Circ Res. 2004;94:1332–1339. - PubMed
    1. Fakler B, Brandle U, Glowatzki E, Weidemann S, Zenner HP, Ruppersberg JP. Strong voltage-dependent inward rectification of inward rectifier K+ channels is caused by intracellular spermine. Cell. 1995;80:149–154. - PubMed
    1. Ficker E, Taglialatela M, Wible BA, Henley CM, Brown AM. Spermine and spermidine as gating molecules for inward rectifier K+ channels. Science. 1994;266:1068–1072. - PubMed

Publication types

MeSH terms