. 2006 Mar 1;571(Pt 2):371-89.
doi: 10.1113/jphysiol.2005.097006. Epub 2005 Dec 22.

Expression and biophysical properties of Kv1 channels in supragranular neocortical pyramidal neurones

Affiliations

Expression and biophysical properties of Kv1 channels in supragranular neocortical pyramidal neurones

D Guan et al. J Physiol. .

Erratum in

  • J Physiol. 2006 Apr 1;572(Pt 1):307

Abstract

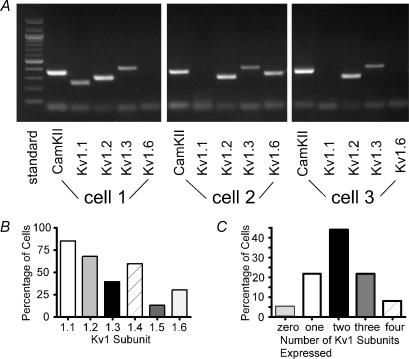
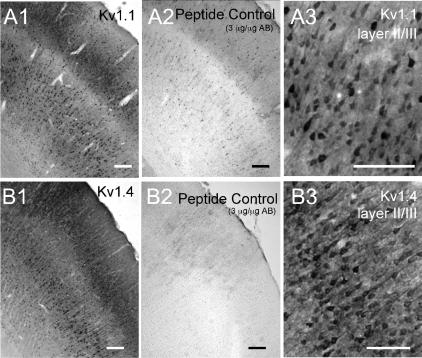
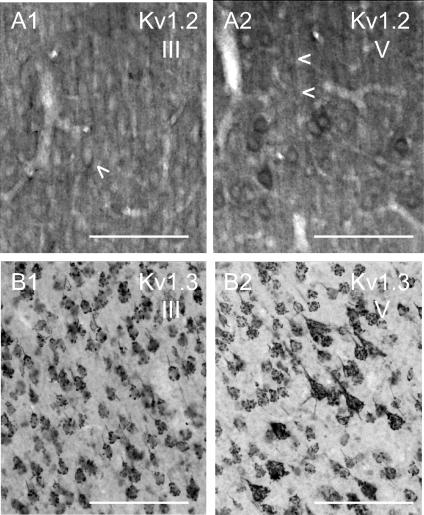
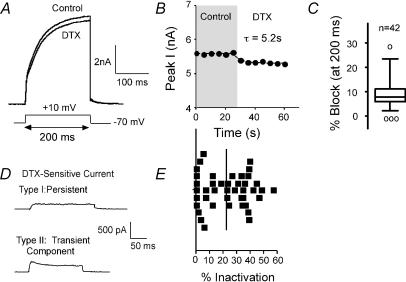
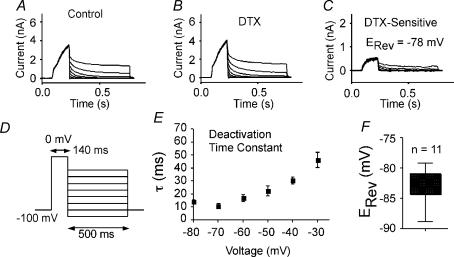
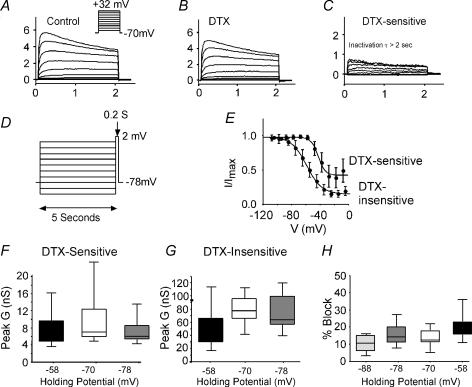
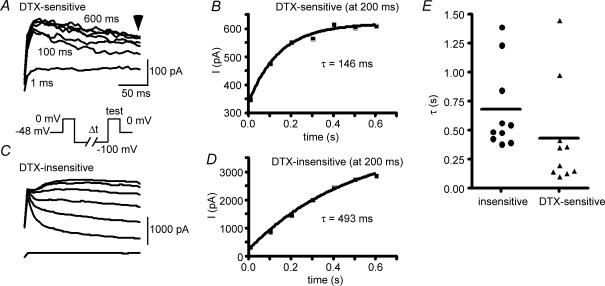
Potassium channels are extremely diverse regulators of neuronal excitability. As part of an investigation into how this molecular diversity is utilized by neurones, we examined the expression and biophysical properties of native Kv1 channels in layer II/III pyramidal neurones from somatosensory and motor cortex. Single-cell RT-PCR, immunocytochemistry, and whole cell recordings with specific peptide toxins revealed that individual pyramidal cells express multiple Kv1 alpha-subunits. The most abundant subunit mRNAs were Kv1.1 > 1.2 > 1.4 > 1.3. All of these subunits were localized to somatodendritic as well as axonal cell compartments. These data suggest variability in the subunit complexion of Kv1 channels in these cells. The alpha-dendrotoxin (alpha-DTX)-sensitive current activated more rapidly and at more negative potentials than the alpha-DTX-insensitive current, was first observed at voltages near action potential threshold, and was relatively insensitive to holding potential. The alpha-DTX-sensitive current comprised about 10% of outward current at steady-state, in response to steps from -70 mV. From -50 mV, this percentage increased to approximately 20%. All cells expressed an alpha-DTX-sensitive current with slow inactivation kinetics. In some cells a transient component was also present. Deactivation kinetics were voltage dependent, such that deactivation was slow at potentials traversed by interspike intervals during repetitive firing. Because of its kinetics and voltage dependence, the alpha-DTX-sensitive current should be most important at physiological resting potentials and in response to brief stimuli. Kv1 channels should also be important at voltages near threshold and corresponding to interspike intervals.


Figures

Figure 1
Figure 1. Kv1 mRNA expression in layer II/III pyramidal neurones from rat somatosensory and motor cortex
A, representative gel for three different cells. All cells expressed CamKII (marker for pyramidal neurones: Jones et al. 1994). Cell 1 expressed Kv1.1, Kv1.2 and Kv1.3, but not Kv1.6. Cell 2 expressed Kv1.2, Kv1.3 and Kv1.6 (not Kv1.1). Cell 3 expressed Kv1.2 and Kv1.3 (not Kv1.1 or Kv1.6). B, bar graph indicating percent of cells expressing each subunit. C, bar graph showing the percentage of cells that expressed each number of subunits.
Figure 2
Figure 2. Immunohistochemical expression of Kv1.1 and Kv1.4
Polyclonal antibodies were obtained from Alamone Laboratories. Both antibodies stained the neuropil in all cortical layers. Scale bars = 100 μm. A, Kv1.1 antibody. A1, low power (4×) view of somatosensory cortex illustrating staining in pyramidal cell layers II/III and V. Note relative lack of labelling in layer IV. A2, pretreatment with absorption peptide eliminated staining. A3, higher power (20×) view of layer II/III showing staining of somas of pyramidal neurones. B, Kv1.4 antibody. B1, low power (4×) view of somatosensory cortex illustrating staining in pyramidal cell layers II/III and V. Note relative lack of labelling in layer IV. B2, pretreatment with absorption peptide eliminated staining. B3, higher power (20×) view of layer II/III showing staining of somas and apical dendrites of pyramidal neurones.
Figure 3
Figure 3. Immunohistochemical expression of Kv1.2 and Kv1.3
The monoclonal Kv1.2 antibody (A) was obtained from Upstate (Waltham, MA, USA). The monoclonal Kv1.3 antibody (B) was a gift from Dr J. Trimmer. Scale bars = 100 μm. A, monoclonal antibody to Kv1.2. A1, layer III of somatosensory cortex (20×), showing relatively homogeneous staining of neuropil, as well as apical dendrites and perisomatic staining (arrowhead). A2, layer V (20×) showing staining of apical dendrites of pyramidal cells (note arrowheads), as well as perisomatic staining of pyramidal cells. B, monoclonal antibody to Kv1.3. B1, layer III of of somatosensory cortex (20×), showing the grape-like punctate pattern of staining over somas/proximal dendrites. B2, layer V (20×) showing the grape-like cluster pattern of staining over somas/proximal dendrites.
Figure 4
Figure 4. Currents sensitive to α-dendrotoxin (α-DTX)
A, α-DTX (DTX) blocked a portion of the current elicited by steps to +10 mV from −70 mV. B, plot of current versus time for cell shown in A. The effect of α-DTX was rapid (τ of 5.2 s in this cell). C, box plot shows variability in response to α-DTX in 42 cells (test step as in A). Line in box indicates median. Outer edges of box represent inner quartile and whiskers indicate outer quartile for data. ○, outliers (Tukey, 1977). D, examples of α-DTX-sensitive currents (at +10 mV) from two different cells. The upper cell showed rapid activation and little inactivation over the 200 ms step. The lower cell exhibited both transient and persistent components. E, scatter plot shows distribution of percentage inactivation over the 42 cells included in C. Vertical line indicates mean value.
Figure 5
Figure 5. Plots of conductance (G) and current density (current divided by whole cell capacitance) versus whole cell capacitance
A, DTX-sensitive. A1, the peak G for the DTX-sensitive current (step to +20 or +30 mV from −70 mV) did not vary with cell size (as estimated by whole cell capacitance: Cm). G was determined by dividing current (at 200 ms) by driving force (EEK). A2, plot of current density (conductance (G) divided by Cm) versus Cm. The density of DTX-sensitive current declined with cell size (Cm). B, remaining DTX-insensitive component. B1, the DTX-insensitive conductance increased with cell size. B2, the DTX-insensitive current density did not vary with cell size.
Figure 6
Figure 6. Specific peptide toxins for Kv1.1 and Kv1.2
A, representative traces for current sensitive to dendrotoxin-K (DTX-K) at 10 nm (upper) and 100 nm (lower). Note initial fast activation and subsequent slow rise of current with time. B, plot of peak current versus time illustrating that DTX-K onset was rapid. C, bar graph (mean ±s.d.) illustrating the percentage of whole cell current (at 200 ms) blocked by DTX-K or δ-DTX. D, representative traces for current blocked by the Kv1.2-specific toxin, r-tityustoxin-Kα (TiTX). The upper trace was from a cell where the TiTX activated rapidly and inactivated very little over the 200 ms test step. The lower trace is from a cell where both transient and persistent components of the TiTX-sensitive current were present. E, plot of peak current versus time showing that the TiTX block was rapid in onset. F, scatter plot of percent inactivation for 7 cells tested with TiTX (10 nm). Vertical line = mean value.
Figure 7
Figure 7. Specific peptide toxin for Kv1.3 and combined toxins
A, representative trace for current sensitive to r-margatoxin (MTX). B, plot of peak current versus time indicating the rate of block by MTX. C, box plots illustrating the distribution of responses to 1 nm or 30 nm MTX. D–F, scatter plots indicating response of cells to combinations of toxins. D, in these cells, DTX-K (10 nm) initially blocked current. In all cells, additional current was blocked by the combination of DTX-K and TiTX (100 nm). E, MTX (1 nm) blocked current. In all cases, α-DTX (500 nm) blocked additional current. F, α-DTX (500 nm) blocked current. In all cases, additional current was blocked by the combination of α-DTX plus MTX (1 nm).
Figure 8
Figure 8. Activation of the α-DTX-sensitive current
A, series of current traces control solution in response to 200 ms voltage steps from −78 mV to various potentials between −70 mV and +32 mV. B, similar family of currents after application of 100 nmα-DTX. C, α-DTX-sensitive currents obtained by subtracting traces in B from those in A. Inset: voltage protocol. D, steady-state activation curve for cell shown in A–C. E, population data for activation time constant (τactivation) as a function of test voltage (n = 19 cells). F, box plots comparing the half-activation voltage (V½) and slope for Boltzmann fits of activation curves for the α-DTX-sensitive and α-DTX-insensitive currents.
Figure 9
Figure 9. Deactivation of the α-DTX-sensitive current
A, control current traces in response to voltage protocol shown in D. B, similar traces after application of 100 nmα-DTX. C, the α-DTX-sensitive current traces (A–B). D, voltage protocol for A–C. E, population data (n = 11) for exponential fits to deactivation. F, box plots showing population data for reversal potential (obtained from protocol in D).
Figure 10
Figure 10. Inactivation of the α-DTX-sensitive current
A, time course of inactivation at various test steps (2 s in duration). Representative traces in control solution. Inset: voltage protocol for A–C. B, traces in presence of 100 nmα-DTX from same cell as in A. C, α-DTX-sensitive current (A–B). At all voltages τinact was > 2 s. D, voltage protocol for studying steady-state inactivation. E, population data for steady-state inactivation. The half-inactivation voltage was −48 ± 2 mV (slope 10 ± 2 mV). F, box plots of peak conductance (G) as a function of holding potential for the α-DTX-sensitive current. There were no significant differences. G, box plots of G as a function of holding potential for the α-DTX-insensitive current. Peak G decreased significantly at −58 mV versus more hyperpolarized holding potentials. H, the percentage of the whole current blocked by α-DTX from various holding potentials. The α-DTX-sensitive current made up a higher percentage at more depolarized holding potentials.
Figure 11
Figure 11. Recovery from inactivation
Cells were held at −40 mV for 5–10 s and then stepped to −100 mV for various times before a test pulse to 0 mV. A, representative traces in response to second voltage step (‘test’ in protocol in inset) for α-DTX-sensitive current (100 nm DTX). Inset: voltage protocol for A and C. B, plot of recovery of test pulse current amplitude for α-DTX-sensitive current (measured at 200 ms). C, the remaining, α-DTX-insensitive current. D, plot of recovery of test pulse current amplitude for remaining, α-DTX-insensitive current. E, scatter plots of recovery time constant for α-DTX-sensitive current and α-DTX-insensitive current. The time constants were not significantly different.

Similar articles

Cited by

References

    1. Alessandri-Haber N, Alcaraz G, Deleuze C, Jullien F, Manrique C, Couraud F, Creste M, Giraud P. Molecular determinants of emerging excitability in rat embryonic motoneurons. J Physiol. 2002;541:25–39. - PMC - PubMed
    1. Baldwin TJ, Tsaur M-L, Lopez GA, Jan YN, Jan LY. Characterization of a mammalian cDNA for an inactivating voltage-sensitive K+ channel. Neuron. 1991;7:471–483. - PubMed
    1. Bekkers JM, Delaney AJ. Modulation of excitability by α-dendrotoxin-sensitive potassium channels in neocortical pyramidal neurons. J Neurosci. 2001;21:6553–6560. - PMC - PubMed
    1. Bossu J-L, Gähwiler BH. Distinct modes of channel gating underlie inactivation of somatic K+ current in rat hippocampal pyramidal cells in vitro. J Physiol. 1996;495:383–397. - PMC - PubMed
    1. Brew HM, Forsythe ID. Two voltage-dependent K+ conductances with complementary functions in postsynaptic integration at a central auditory synapse. J Neurosci. 1995;15:8011–8022. - PMC - PubMed

Publication types

MeSH terms