PTEN negatively regulates neural stem cell self-renewal by modulating G0-G1 cell cycle entry
- PMID: 16373498
- PMCID: PMC1325011
- DOI: 10.1073/pnas.0509939103
PTEN negatively regulates neural stem cell self-renewal by modulating G0-G1 cell cycle entry
Abstract
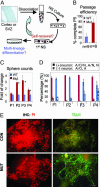
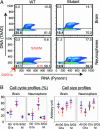
Previous studies have demonstrated that a small subpopulation of brain tumor cells share key characteristics with neural stem/progenitor cells in terms of phenotype and behavior. These findings suggest that brain tumors might contain "cancer stem cells" that are critical for tumor growth. However, the molecular pathways governing such stem cell-like behavior remain largely elusive. Our previous study suggests that the phosphatase and tensin homologue deleted on chromosome 10 (PTEN) tumor suppressor gene, one of the most frequently mutated genes in glioblastomas, restricts neural stem/progenitor cell proliferation in vivo. In the present study, we sought to determine the role of PTEN in long-term maintenance of stem cell-like properties, cell cycle entry and progression, and growth factor dependence and gene expression. Our results demonstrate an enhanced self-renewal capacity and G(0)-G(1) cell cycle entry and decreased growth factor dependency of Pten null neural/stem progenitor cells. Therefore, loss of PTEN leads to cell physiological changes, which collectively are sufficient to increase the pool of self-renewing neural stem cells and promote their escape from the homeostatic mechanisms of proliferation control.
Figures


References
-
- Li, J., Yen, C., Liaw, D., Podsypanina, K., Bose, S., Wang, S. I., Puc, J., Miliaresis, C., Rodgers, L., McCombie, R., et al. (1997) Science 275, 1943–1947. - PubMed
-
- Steck, P. A., Pershouse, M. A., Jasser, S. A., Yung, W. K., Lin, H., Ligon, A. H., Langford, L. A., Baumgard, M. L., Hattier, T., Davis, T., et al. (1997) Nat. Genet. 15, 356–362. - PubMed
-
- Li, J., Simpson, L., Takahashi, M., Miliaresis, C., Myers, M. P., Tonks, N. & Parsons, R. (1998) Cancer Res. 58, 5667–5672. - PubMed
-
- Liaw, D., Marsh, D. J., Li, J., Dahia, P. L., Wang, S. I., Zheng, Z., Bose, S., Call, K. M., Tsou, H. C., Peacocke, M., et al. (1997) Nat. Genet. 16, 64–67. - PubMed
-
- Nelen, M. R., van Staveren, W. C., Peeters, E. A., Hassel, M. B., Gorlin, R. J., Hamm, H., Lindboe, C. F., Fryns, J. P., Sijmons, R. H., Woods, D. G., et al. (1997) Hum. Mol. Genet. 6, 1383–1387. - PubMed
Publication types
MeSH terms
Substances
Grants and funding
LinkOut - more resources
Full Text Sources
Other Literature Sources
Medical
Molecular Biology Databases
Research Materials

