. 2006 May 1;107(9):3669-75.
doi: 10.1182/blood-2005-09-3810. Epub 2005 Dec 22.

Clinical implication of centrosome amplification in plasma cell neoplasm

Affiliations

Clinical implication of centrosome amplification in plasma cell neoplasm

Wee J Chng et al. Blood. .

Abstract

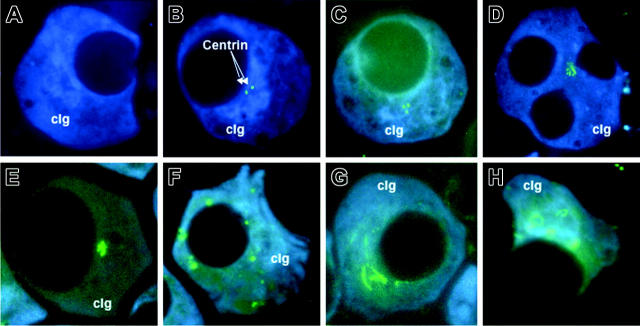
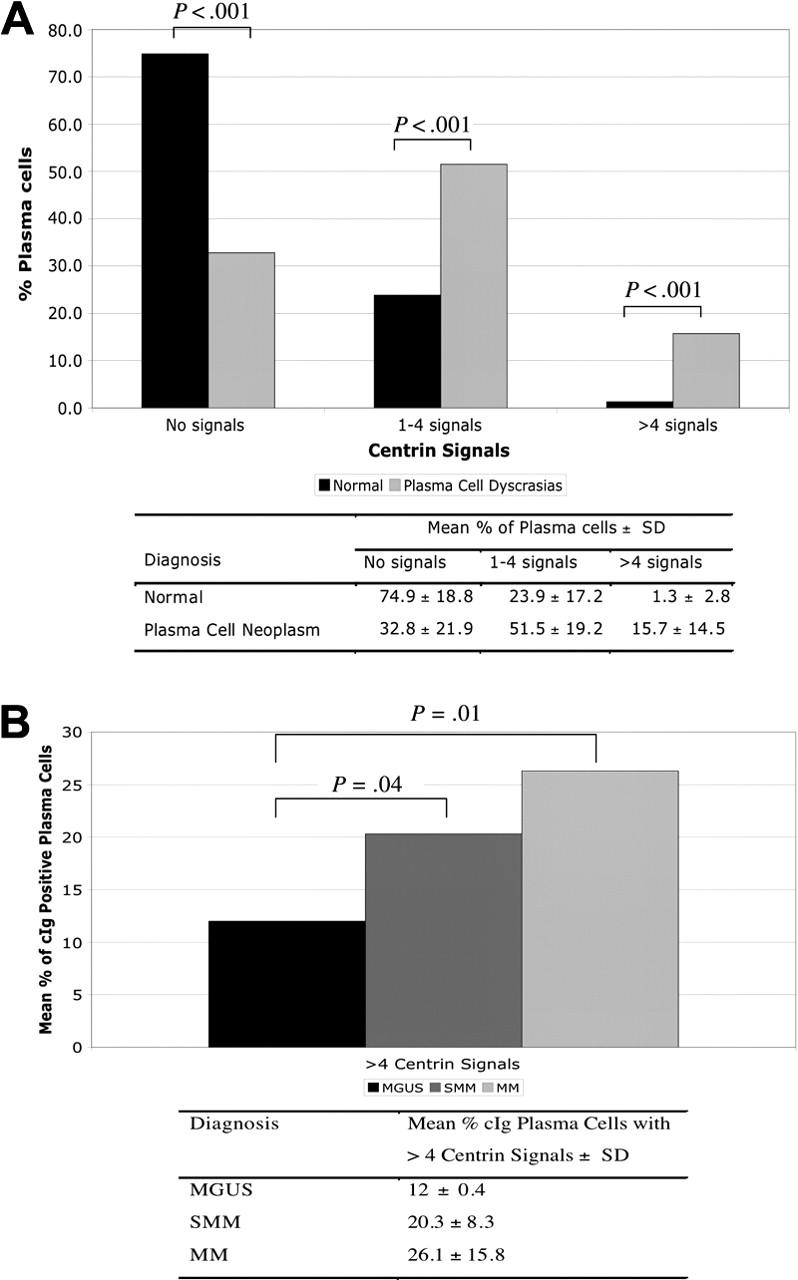
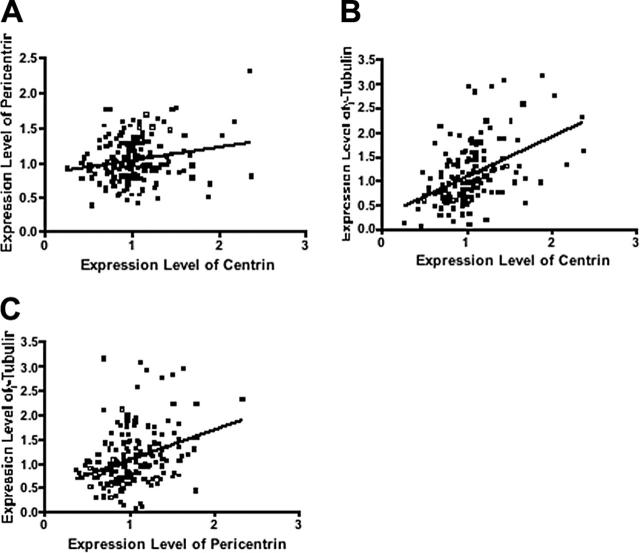
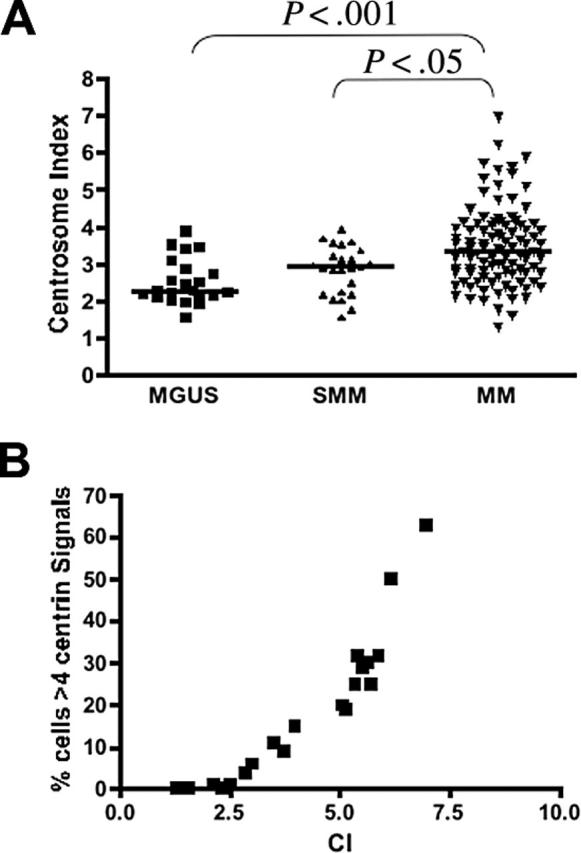
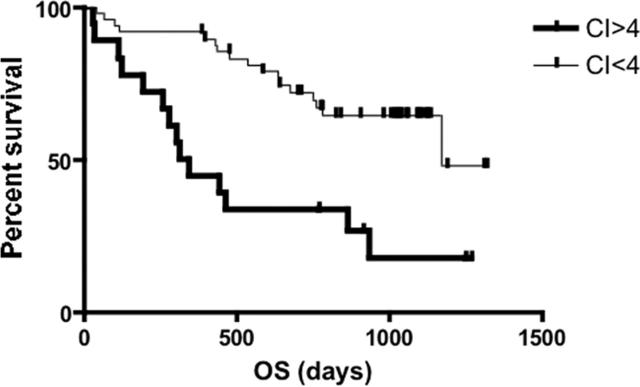
The mechanisms underlying aneuploidy in multiple myeloma (MM) are unclear. Centrosome amplification has been implicated as the cause of chromosomal instability in a variety of tumors and is a potential mechanism causing aneuploidy in MM. Using immunofluorescent (IF) staining, centrosome amplification was detected in 67% of monoclonal gammopathies, including monoclonal gammopathy of undetermined significance (MGUS). We also investigated the gene expression of centrosome proteins. Overall, gene expression data correlated well with IF-detected centrosome amplification, allowing us to derive a gene expression-based centrosome index (CI) as a surrogate for centrosome amplification. Clinically, MM patients with high CI (> 4) are associated with poor prognostic genetic and clinical subtypes (chromosome 13 deletion, t(4; 14), t(14;16), and PCLI > 1%, P < .05) and are shown here to have short survival (11.1 months versus 39.1 months, P < .001). On multivariate regression, a high CI is an independent prognostic factor. Given that centrosome amplification is already observed in MGUS and probably integral to early chromosomal instability and myeloma genesis, and patients with more extensive centrosome amplification have shorter survival, the mechanisms leading to centrosome amplification should be investigated because these may offer new avenues for therapeutic intervention.


Figures

Figure 1.
Figure 1.
Different patterns of centrin staining. The isotypic PCs were identified by cytoplasmic κ or λ light-chain antibody conjugated with AMCA (cIg, blue), and centrin was stained with anticentrin2 conjugated with Alexa 488 (arrow; green). (A) Most PCs from healthy donors had no signals. (B-C) Cells with 1 to 4 signals were considered to have normal centrosome. (D-E) Centrosome amplification was seen in typical clonal PCs as well as the rare multinucleated PCs in patients. Various centrosome abnormalities were seen as follows: (D-E) increased number of signals in a cluster, (F) increased signals that were scattered, (G) coalescence of centrins into string-like structures, and (H) centrins staining up as ring-like structure. Abnormal centrosome structure as seen in panels F to H were predominantly seen in MM. The cells were visualized with a Leitz Epifluorescence microscope using a 100 ×/1.4 NA oil objective lens (Leitz, Wetzlar, Germany). The images were captured with the CoolSNAP ES CCD camera (Photometrics, Tucson, AZ) and acquired using either the Vysis smart capture software (Vysis, Downer's Grove, IL) or Oncor imaging system software (Oncor, Gaithersburg, MD). The acquired images were subsequently processed with Adobe Photoshop 7.0 (Adobe Systmes, San Jose, CA).
Figure 2.
Figure 2.
Centrin staining and centrosome amplification in healthy donors and patients with monoclonal gammopathies. (A) Majority of normal PCs had no centrin signals compared with clonal plasma cells (P < .001), whereas centrosome amplification was almost exclusively seen in clonal PCs (P < .001). (B) Percentage of cIg-positive PCs with centrosome amplification increased with more advance stage of PC proliferation.
Figure 3.
Figure 3.
Expression levels of centrosome proteins are closely correlated. Expression levels of centrin were correlated with (A) pericentrin (r = 0.16; P = .046) and (B) γ-tubulin (r = 0.47; P < .001). (C) Pericentrin was also correlated with γ-tubulin (r = 0.35; P < .001).
Figure 4.
Figure 4.
Gene expression based centrosome index (CI) in PC neoplasm. (A) CI increased progressively from MGUS (n = 23; median CI, 2.27; range, 1.56-3.90) to SMM (n = 25; median CI, 2.91; range, 1.58-3.91) to MM (n = 97; median CI, 3.36; range, 1.29-6.97). The pairs represented by the brackets were significantly different. (B) In the 20 patients with MM in group 2 in which IF was also performed, the CI was highly correlated with the percentage of clonal plasma with abnormal (> 4) centrin signals (Spearman correlation coefficient r = 0.97; P < .001).
Figure 5.
Figure 5.
Kaplan-Meier curve for OS of newly diagnosed MM in patients (n = 72) stratified by CI. Patients with CI more than 4 (n = 18) had significantly shorter survival compared with patients with CI less than 4 (n = 49) (median OS, 11.1 months versus 39.1 months; log-rank P < .001).

References

    1. Lengauer C, Kinzler KW, Vogelstein B. Genetic instabilities in human cancers. Nature. 1998;396: 643-649. - PubMed
    1. Pihan GA, Purohit A, Wallace J, et al. Centrosome defects and genetic instability in malignant tumors. Cancer Res. 1998;58: 3974-3985. - PubMed
    1. Balmain A, Gray J, Ponder B. The genetics and genomics of cancer. Nat Genet. 2003;33(suppl): 238-244. - PubMed
    1. Pihan G, Doxsey SJ. Mutations and aneuploidy: co-conspirators in cancer? Cancer Cell. 2003;4: 89-94. - PubMed
    1. Cahill DP, Lengauer C, Yu J, et al. Mutations of mitotic checkpoint genes in human cancers. Nature. 1998;392: 300-303. - PubMed

Publication types

Substances