Comparative Study
. 2006 Feb 10;494(5):815-33.
doi: 10.1002/cne.20844.

Abnormal expression of the G-protein-activated inwardly rectifying potassium channel 2 (GIRK2) in hippocampus, frontal cortex, and substantia nigra of Ts65Dn mouse: a model of Down syndrome

Affiliations
Comparative Study

Abnormal expression of the G-protein-activated inwardly rectifying potassium channel 2 (GIRK2) in hippocampus, frontal cortex, and substantia nigra of Ts65Dn mouse: a model of Down syndrome

Chie Harashima et al. J Comp Neurol. .

Abstract

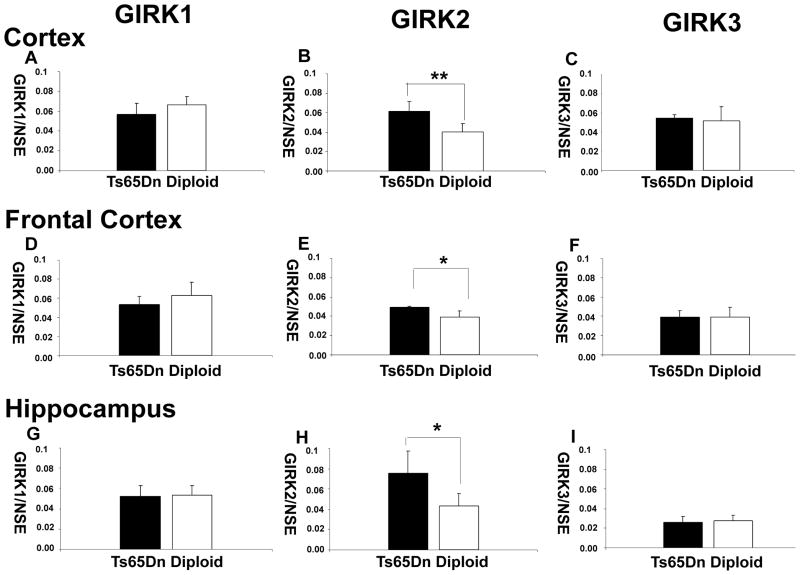
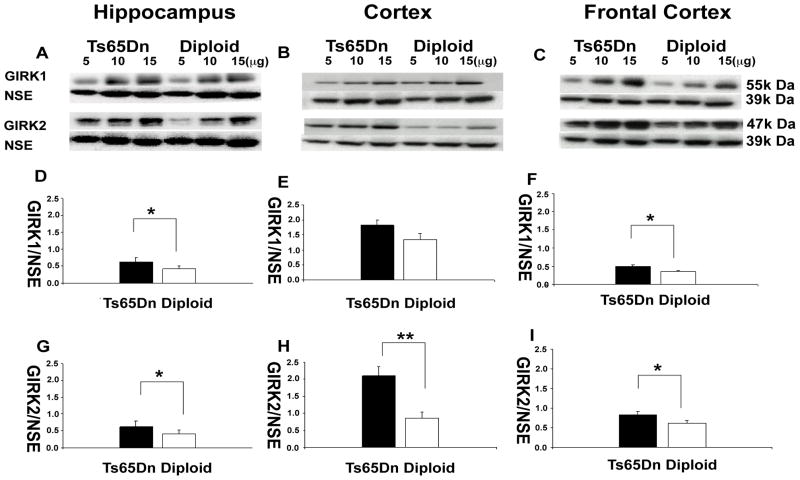
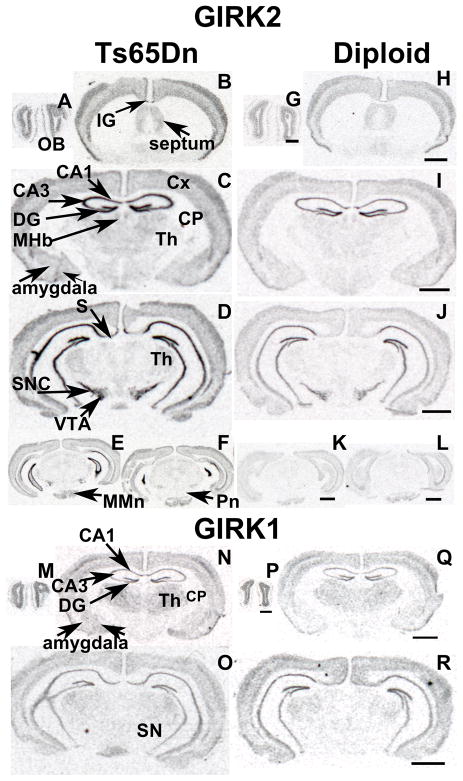
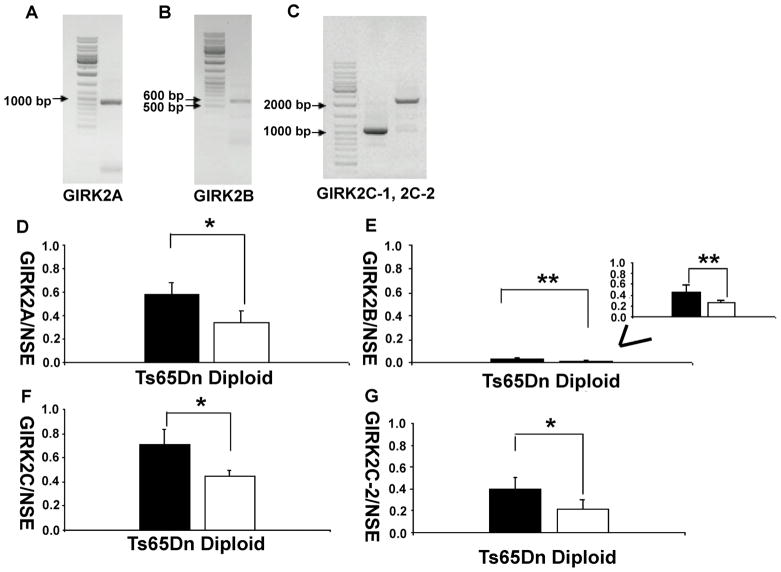
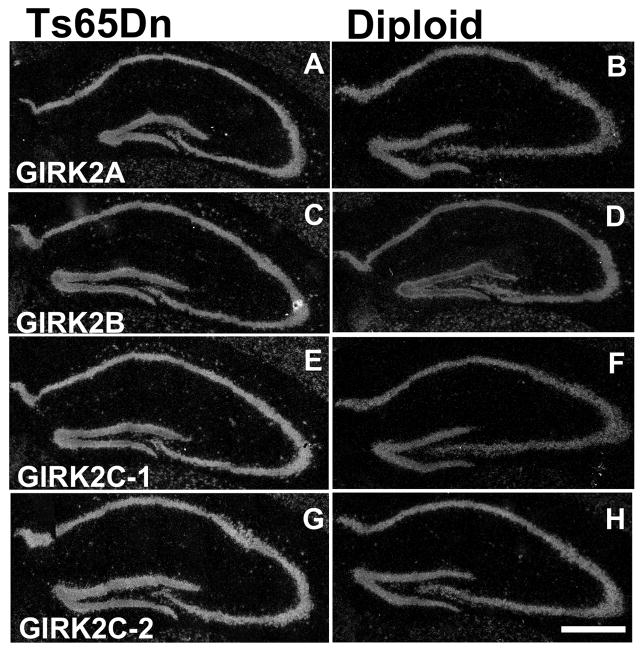
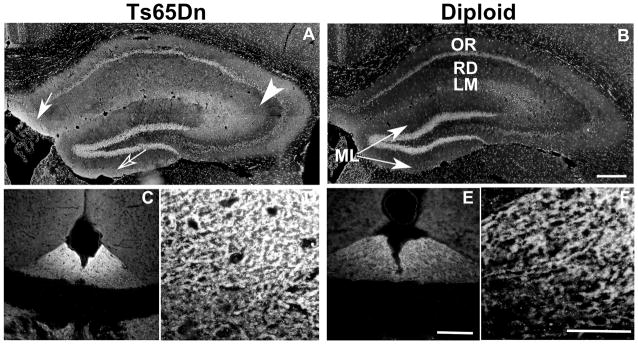
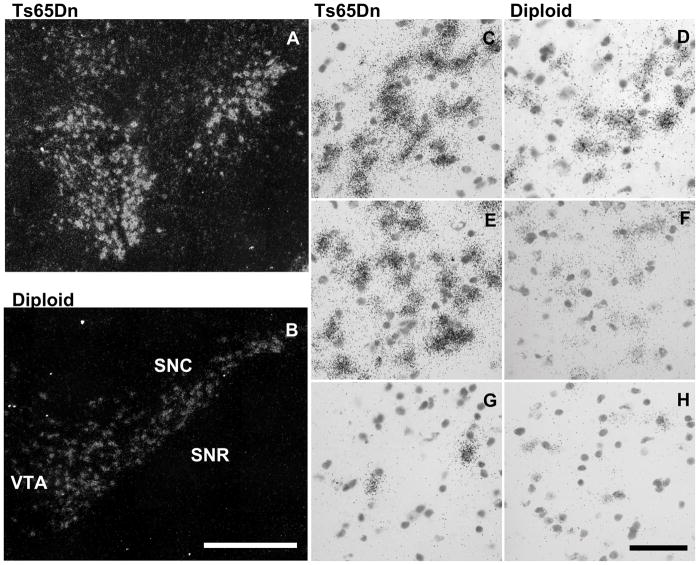
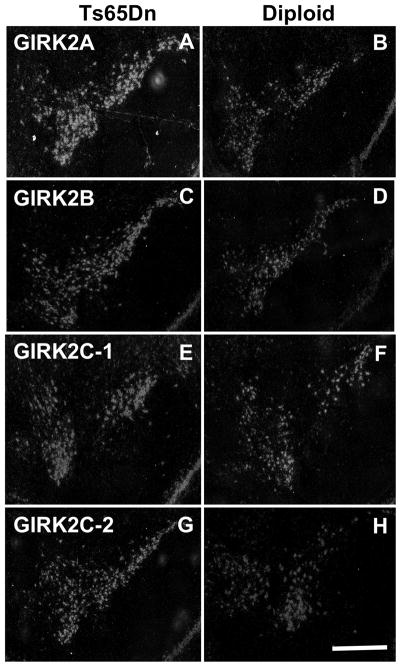
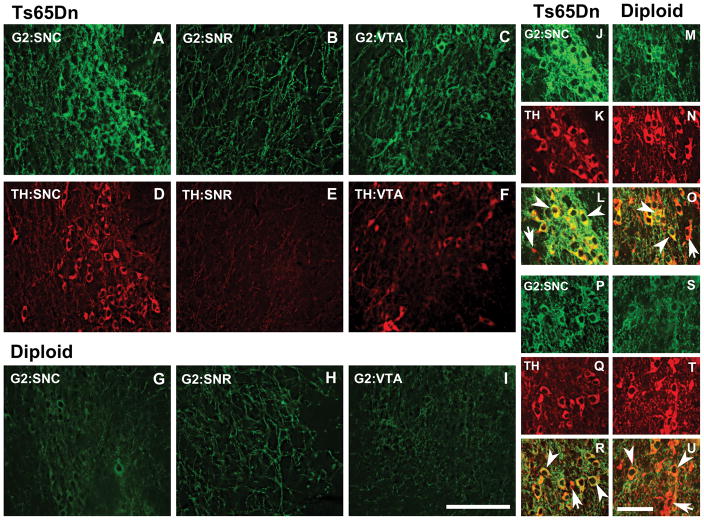
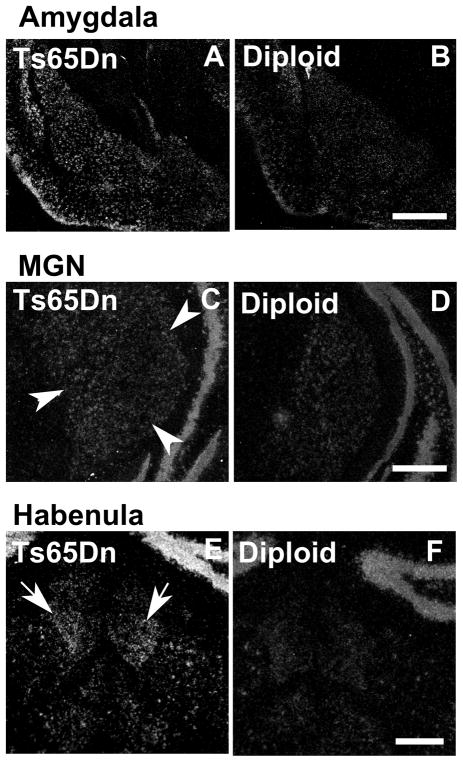
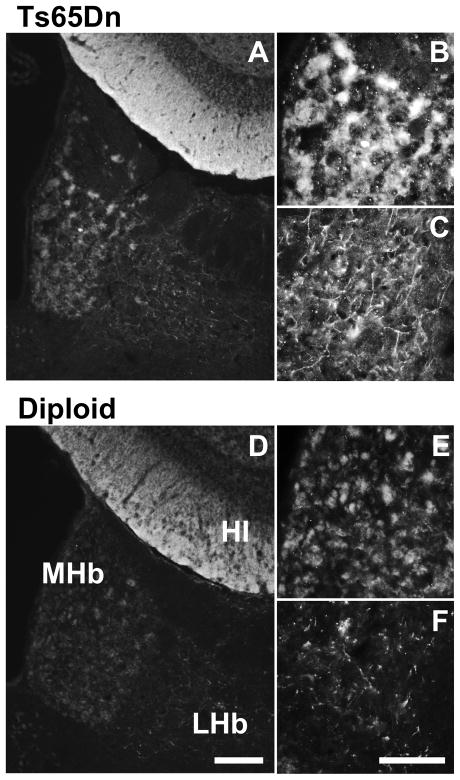
Ts65Dn, a mouse model of Down syndrome (DS), demonstrates abnormal hippocampal synaptic plasticity and behavioral abnormalities related to spatial learning and memory. The molecular mechanisms leading to these impairments have not been identified. In this study, we focused on the G-protein-activated inwardly rectifying potassium channel 2 (GIRK2) gene that is highly expressed in the hippocampus region. We studied the expression pattern of GIRK subunits in Ts65Dn and found that GIRK2 was overexpressed in all analyzed Ts65Dn brain regions. Interestingly, elevated levels of GIRK2 protein in the Ts65Dn hippocampus and frontal cortex correlated with elevated levels of GIRK1 protein. This suggests that heteromeric GIRK1-GIRK2 channels are overexpressed in Ts65Dn hippocampus and frontal cortex, which could impair excitatory input and modulate spike frequency and synaptic kinetics in the affected regions. All GIRK2 splicing isoforms examined were expressed at higher levels in the Ts65Dn in comparison to the diploid hippocampus. The pattern of GIRK2 expression in the Ts65Dn mouse brain revealed by in situ hybridization and immunohistochemistry was similar to that previously reported in the rodent brain. However, in the Ts65Dn mouse a strong immunofluorescent staining of GIRK2 was detected in the lacunosum molecular layer of the CA3 area of the hippocampus. In addition, tyrosine hydroxylase containing dopaminergic neurons that coexpress GIRK2 were more numerous in the substantia nigra compacta and ventral tegmental area in the Ts65Dn compared to diploid controls. In summary, the regional localization and the increased brain levels coupled with known function of the GIRK channel may suggest an important contribution of GIRK2 containing channels to Ts65Dn and thus to DS neurophysiological phenotypes.


Figures

Fig. 1
Fig. 1
Representation of Ts65Dn (left, ~ 104 genes), Ts1Cje (middle, between Sod1-Mx1, ~81 genes) and Ts1Rhr (right, Cbr1-Mx1, ~33 genes) chromosomal segments that originated from mouse chromosome 16. Right bar also represents homologous segment with the so-called Down syndrome critical region. Note that the Girk2 gene (KCNJ6) is present in each of the Ts65Dn, Ts1Cje and Ts1Rhr fragments. Abbreviations: App; amyloid precursor protein, Glur5; glutamate receptor subunit 5, Sod1; superoxide dismutase-1, Synj1; synaptojanin-1, Sim2; single-minded 2, Cbr1-carbonyl reductase 1, Dyrk1a/Mnbh; dual-specificity tyrosine-(Y)-phosphorylation regulated kinase, Kcnj6/GIRK2; G-protein activated inwardly rectifying potassium channel subunit 2, Ets2; avian leukemia oncogene 2,3′ domain, Mx1/Tmprss2; myxovirus resistance-1/transmembrane protease, serine 2.
Fig. 2
Fig. 2
Real time RT-PCR analysis of GIRK1 (A, D, G), GIRK2 (B, E, H) and GIRK3 (C, F, I) expressions in Ts65Dn (solid bars; N = 5) and diploid littermate (open bars; n = 5) cortex (A, B, C), frontal cortex (D, E, F) and hippocampus (G, H, I). GIRK2 mRNA was over-expressed in cerebral cortex (1.5-fold, P<0.001), frontal cortex (1.3-fold, P=0.017) and hippocampus (1.7-fold, P=0.012) compared to diploid littermates. The expression levels of GIRK1 and GIRK3 mRNAs were not significantly different between Ts65Dn and diploid littermates in all brain areas. Results are mean ± SEM. 0.01 ≤≤ *P < 0.05, **P < 0.01, significantly different from diploid littermates.
Fig. 3
Fig. 3
Western blot analysis indicates that GIRK1 and GIRK2 are over-expressed in Ts65Dn hippocampus and frontal cortex. Western immunoblots of Ts65Dn (N = 5) hippocampus (A: lane 1, 2 and 3) and diploid littermates (A: lane 4, 5 and 6; N = 5), Ts65Dn cerebral cortex (B: lane 1, 2 and 3) and diploid littermates (B: lane 4, 5 and 6) and Ts65Dn frontal cortex (C: lane 1, 2 and 3) and diploid littermates (C: lane 4, 5 and 6). Anti-GIRK1 or anti-GIRK2 antibodies detected bands of 55 kDa (top of A, B, C) and 47 kDa (third of A, B, C) respectively. Anti-NSE antibody detected bands of 39 kDa (second and bottom of A, B, C). Samples containing approximately 5 (lane 1, 4), 10 (lane 2, 5) and 15 μg (lane 3, 6) of protein were loaded. Bands of NSE appeared depending on loading amounts. Histograms (D–I) represent the normalized to NSE signals detected from hippocampus, cerebral cortex and frontal cortex immunoblots probed with antibodies specific for GIRK1 (D, E, F) and for GIRK2 (G, H, I) for Ts65Dn (solid bars) and diploid littermates (open bars) samples. Ts65Dn cerebral cortex significantly over-expressed GIRK2 (2.44-fold, P=<0.01), but not GIRK1 subunits compared with diploid littermates. In Ts65Dn hippocampus and frontal cortex both GIRK2 and GIRK1 subunits are overexpressed with the respective following increases: GIRK2 (1.37-fold P=0.011 and 1.45-fold P=0.048), GIRK1 (1.43-fold P=0.047 and 1.50-fold P=0.032). The results are mean ± SEM. *P < 0.05, significantly different from littermates.
Fig. 4
Fig. 4
Film autoradiographs show elevated GIRK2 mRNA expression in Ts65Dn (N = 7) brain (A–F) in comparison to diploid littermates (N = 7) (G–L) and increase in GIRK1 mRNA expression in thalamus of Ts65Dn brain (M–O) in comparison to diploid littermates (P–R). A similar region-specific pattern of expression of GIRK2 and GIRK1 subunits was revealed in both Ts65Dn and diploid brains. Abbreviations: OB; olfactory bulb, IG; indusium griseum, DG; dentate gyrus, Cx; cortex, Th; thalamus, CP; caudate putamen, MHb; medial habenula, SN; substantia nigra, SNC; substantia nigra, compacta, VTA; ventral tegmental area, S; subiculum, MMn; mammillary nucleus, Pn; pontine nucleus. Scale bars = 1 mm (G, P), 1.5 mm (H, K, L), 2 mm (I, J, Q, R).
Fig. 5
Fig. 5
All investigated GIRK2 splicing isoforms are elevated in Ts65Dn hippocampus (N = 5) in comparison to diploid littermates (N = 5). The PCR products amplified with primer pairs of GIRK2A, 2B, 2C-1 and 2C-2 show each band of expected size (A). Real-time RT-PCR analysis using primer pairs of GIRK 2A, 2B, 2C or 2C-2 that show four GIRK2 isoforms were significantly over-expressed in the Ts65Dn (solid bars) in comparison to diploid littermates (open bars) with the following levels: GIRK2A, 1.8-fold (p=0.029); GIRK2B, 1.9-fold (p=0.0067), GIRK2C, 1.6-fold (p=0.031); GIRK2C-2, 1.7-fold (p=0.041) (B, C, D, E). The results are mean ± SEM. *P < 0.05, **P < 0.01, significantly different from diploid littermates.
Fig. 6
Fig. 6
GIRK2 splicing isoforms mRNAs expression patterns in Ts65Dn (N = 7) and diploid (N = 7) hippocampi. GIRK2 hippocampi levels are elevated in Ts65Dn in comparison to diploid littermates mice. GIRK2A, 2B, 2C-1 and 2C-2, profiles of expression are similar in Ts65Dn hippocampus (A, C, E, G) and diploid littermates (B, D, F, H). Scale bars = 500 μm (H).
Fig. 7
Fig. 7
Immunohistochemical detection of GIRK2 in Ts65Dn hippocampus (A: N = 6) shows stronger immunostaining (arrowhead) in the “hot spot” lateral to the dentate gyrus and lacunosum moleculare (LM) than the diploid littermate (B: N = 6). Open arrow in (A) points to the ventral leaf of Ts65Dn molecular layer (ML) area where GIRK2 is highly expressed. Abbreviations: OR; striatum oriens, RD; radiatum, LM; lacunosum moleculare, ML; molecular layer. (C–F) Immunofluorescence signals of indusium griseum are stronger in fibers and some cells of Ts65Dn (C, D) compared to diploid littermates (E, F). Scale bars = 500 μm (B), 250 μm (E), 125 μm (F).
Fig. 8
Fig. 8
Darkfield photographs show GIRK2 mRNA pattern of expression in substantia nigra (SN) with a radioprobe that recognizes all isoforms in Ts65Dn (N = 7) (A) and in diploid littermates (N = 7) (B). Brightfield photographs of Nissl-stained sections hybridized for GIRK2 mRNA for SN compacta (SNC), ventral tegmental area (VTA) and SN reticulata (SNR) in Ts65Dn (C, E, G) and diploid littermate (D, F, H). Ts65Dn SN over-expressed GIRK2 mRNA compared with diploid littermates. Scale bars = 750 μm (B), 50 μm (H).
Fig. 9
Fig. 9
Darkfield photographs show mRNA pattern of expression in SN of GIRK2A, GIRK2B, GIRK2C-1 and GIRK2C-2 splicing isoforms in Ts65Dn (A, C, E, G) and diploid littermate (B, D, F, H). In Ts65Dn SN each GIRK2 isoform mRNA is over-expressed compared to the diploid littermates, with a different pattern of over-expression for each isoform. Scale bar = 500 μm (H).
Fig. 10
Fig. 10
GIRK2 immunofluorescence signals in SNC, SNR and VTA of Ts65Dn (A, B, C: N = 6) and diploid littermates (G, H, I: N = 6). Ts65Dn showed stronger immunofluorescent staining than diploid littermates. (D–F) Tyrosine hydroxylase (TH, red) immunofluorescence signals of SNC, SNR and VTA of Ts65Dn. (J–U) Co-expression of TH (red) and GIRK2 (G2, green) in dopaminergic neurons in the SNC (J–O) and VTA (P–U) revealed that not all TH positive neurons are GIRK2 positive in Ts65Dn (J, K, L, P, Q, R) and diploid littermates (M, N, O, S, T, U). Scale bars = 60 μm (I), 50 μm (U). Arrowheads point to dopaminergic cells that co-expressed GIRK2 and TH (orange). Arrows point to the cells with only TH (red).
Fig. 11
Fig. 11
High expression of GIRK2 mRNA in Ts65Dn in comparison to diploid littermates in amygdala, medial geniculate nucleus (MGN) and habenula. (A–B) The amygdala in Ts65Dn mice has more GIRK2 mRNA grains (A) than diploid littermate (B). (C–D) The MGN in Ts65Dn mice (C: arrowheads) shows more GIRK2 mRNA than diploid littermates (D). The medial habenular nucleus (arrows) in Ts65Dn (E) has more grains than diploid littermates (F). Scale bar = 1 mm (B, D, F).
Fig. 12
Fig. 12
Fluorescence immunohistochemical study shows abundant signals in cell bodies of medial habenula (MHb) (A, B) and in fibers of lateral habenula (LHb) in Ts65Dn (C) compared with diploid littermates (D, E and F). Scale bars = 750 μm (D), 200 μm (F).

Similar articles

Cited by

References

    1. Adeniji-Adele A, Harashima C, Best T, Stoffel M, Galdzicki Z, Siarey RJ. Long-term potentiation and depression in the GIRK2−/− mouse. 34rd Annual Meeting of Society for Neuroscience; 2004; 2004. p. 56.16.
    1. Antonarakis SE. Parental origin of the extra chromosome in trisomy 21 as indicated by analysis of DNA polymorphisms. Down Syndrome Collaborative Group. N Engl J Med. 1991;324:872–876. - PubMed
    1. Belichenko PV, Masliah E, Kleschevnikov AM, Villar AJ, Epstein CJ, Salehi A, Mobley WC. Synaptic structural abnormalities in the Ts65Dn mouse model of Down Syndrome. J Comp Neurol. 2004;480:281–298. - PubMed
    1. Bimonte-Nelson HA, Hunter CL, Nelson ME, Granholm AC. Frontal cortex BDNF levels correlate with working memory in an animal model of Down syndrome. Behav Brain Res. 2003;139:47–57. - PubMed
    1. Burger PC, Vogel FS. The development of the pathologic changes of Alzheimer’s disease and senile dementia in patients with Down’s syndrome. Am J Pathol. 1973;73:457–476. - PMC - PubMed

Publication types

MeSH terms

Substances