

The diagnostic value of biomarkers (SteatoTest) for the prediction of liver steatosis
- PMID: 16375767
- PMCID: PMC1327680
- DOI: 10.1186/1476-5926-4-10
The diagnostic value of biomarkers (SteatoTest) for the prediction of liver steatosis
Abstract
Background: Biopsy is the usual gold standard for liver steatosis assessment. The aim of this study was to identify a panel of biomarkers (SteatoTest), with sufficient predictive values, for the non-invasive diagnosis of steatosis in patients with or without chronic liver disease. Biomarkers and panels were assessed in a training group of consecutive patients with chronic hepatitis C and B, alcoholic liver disease, and non-alcoholic fatty liver disease, and were validated in two independent groups including a prospective one. Steatosis was blindly assessed by using a previously validated scoring system.
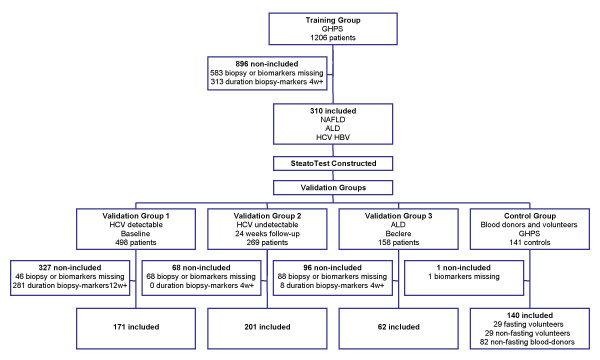
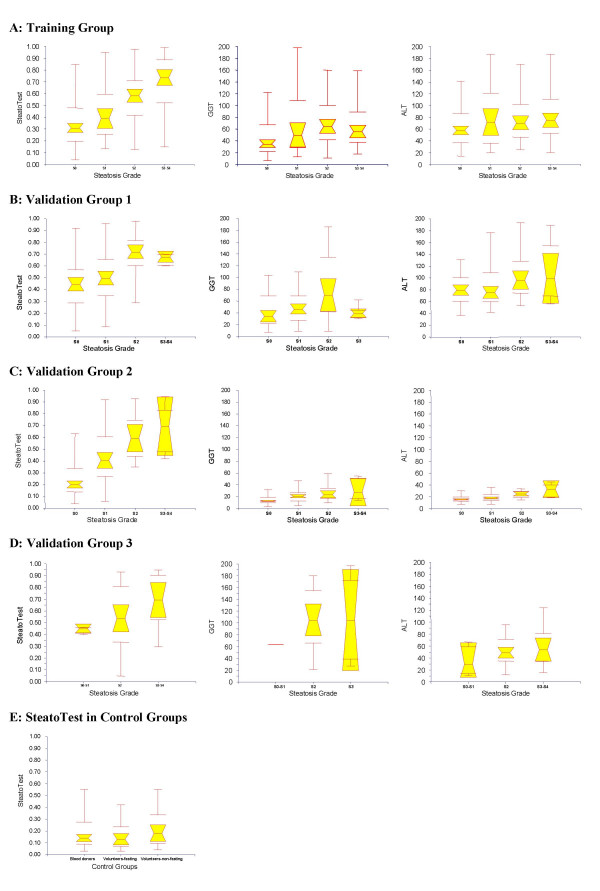
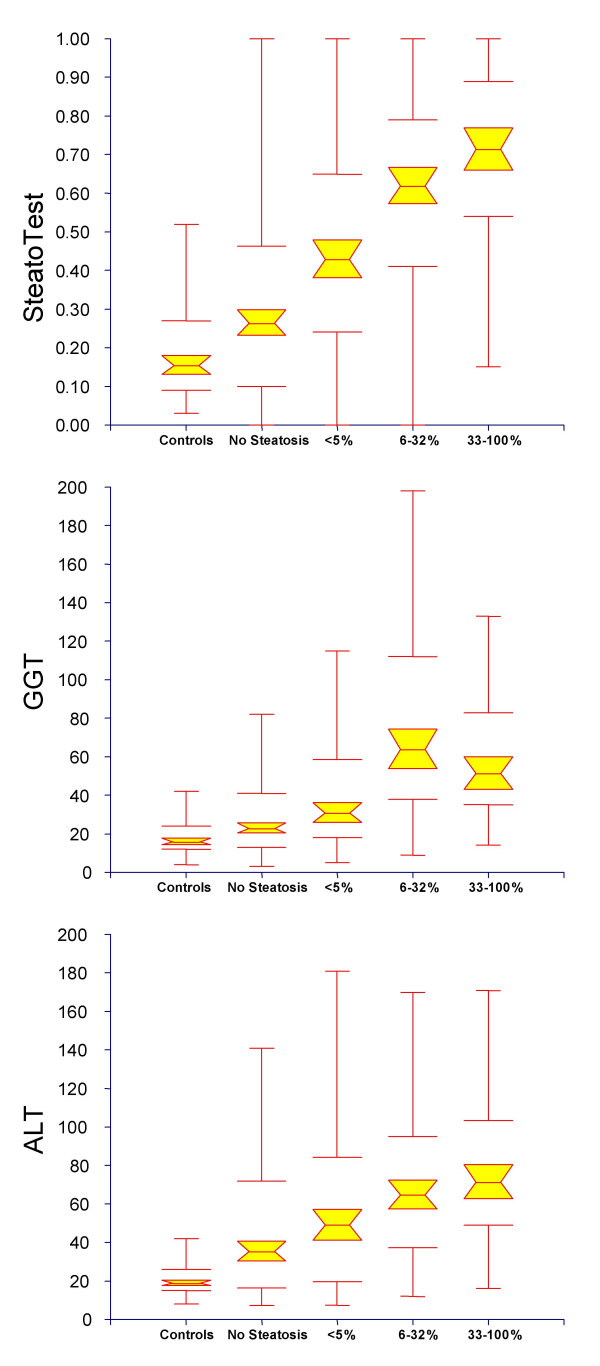
Results: 310 patients were included in the training group; 434 in three validation groups; and 140 in a control group. SteatoTest was constructed using a combination of the 6 components of FibroTest-ActiTest plus body mass index, serum cholesterol, triglycerides, and glucose adjusted for age and gender. SteatoTest area under the ROC curves was 0.79 (SE = 0.03) in the training group; 0.80 (0.04) in validation group 1; 0.86 (0.03) in validation group 2; and 0.72 (0.05) in the validation group 3 - all significantly higher than the standard markers: gamma-glutamyl-transpeptidase or alanine aminotransferase. The median SteatoTest value was 0.13 in fasting controls; 0.16 in non-fasting controls; 0.31 in patients without steatosis; 0.39 in grade 1 steatosis (0-5%); 0.58 in grade 2 (6-32%); and 0.74 in grade 3-4 (33-100%). For the diagnosis of grade 2-4 steatosis, the sensitivity of SteatoTest at the 0.30 cut-off was 0.91, 0.98, 1.00 and 0.85 and the specificity at the 0.70 cut-off was 0.89, 0.83, 0.92, 1.00, for the training and three validation groups, respectively.
Conclusion: SteatoTest is a simple and non-invasive quantitative estimate of liver steatosis and may reduce the need for liver biopsy, particularly in patients with metabolic risk factor.
Figures
Similar articles
-
Performance of biomarkers FibroTest, ActiTest, SteatoTest, and NashTest in patients with severe obesity: meta analysis of individual patient data.PLoS One. 2012;7(3):e30325. doi: 10.1371/journal.pone.0030325. Epub 2012 Mar 14. PLoS One. 2012. PMID: 22431959 Free PMC article.
-
Comparison of fatty liver index with noninvasive methods for steatosis detection and quantification.World J Gastroenterol. 2013 Jan 7;19(1):57-64. doi: 10.3748/wjg.v19.i1.57. World J Gastroenterol. 2013. PMID: 23326163 Free PMC article.
-
Diagnostic performance of FibroTest, SteatoTest and ActiTest in patients with NAFLD using the SAF score as histological reference.Aliment Pharmacol Ther. 2016 Oct;44(8):877-89. doi: 10.1111/apt.13770. Epub 2016 Aug 23. Aliment Pharmacol Ther. 2016. PMID: 27549244 Free PMC article.
-
FibroMAX: towards a new universal biomarker of liver disease?Expert Rev Mol Diagn. 2007 Sep;7(5):481-90. doi: 10.1586/14737159.7.5.481. Expert Rev Mol Diagn. 2007. PMID: 17892356 Review.
-
[Non-invasive assessment of fatty liver].Orv Hetil. 2015 Apr 5;156(14):543-51. doi: 10.1556/OH.2015.30123. Orv Hetil. 2015. PMID: 25819147 Review. Hungarian.
Cited by
-
Nonalcoholic Fatty Liver Disease in Lean/Nonobese and Obese Individuals: A Comprehensive Review on Prevalence, Pathogenesis, Clinical Outcomes, and Treatment.J Clin Transl Hepatol. 2023 Apr 28;11(2):502-515. doi: 10.14218/JCTH.2022.00204. Epub 2022 Dec 23. J Clin Transl Hepatol. 2023. PMID: 36643037 Free PMC article. Review.
-
Clinical and Molecular Biomarkers for Diagnosis and Staging of NAFLD.Int J Mol Sci. 2021 Nov 2;22(21):11905. doi: 10.3390/ijms222111905. Int J Mol Sci. 2021. PMID: 34769333 Free PMC article. Review.
-
Concordance in a world without a gold standard: a new non-invasive methodology for improving accuracy of fibrosis markers.PLoS One. 2008;3(12):e3857. doi: 10.1371/journal.pone.0003857. Epub 2008 Dec 4. PLoS One. 2008. PMID: 19052646 Free PMC article.
-
Prediction for steatosis in type-2 diabetes: clinico-biological markers versus 1H-MR spectroscopy.Eur Radiol. 2012 Apr;22(4):855-63. doi: 10.1007/s00330-011-2326-9. Epub 2011 Nov 20. Eur Radiol. 2012. PMID: 22101800
-
Fatty liver index vs waist circumference for predicting non-alcoholic fatty liver disease.World J Gastroenterol. 2016 Mar 14;22(10):3023-30. doi: 10.3748/wjg.v22.i10.3023. World J Gastroenterol. 2016. PMID: 26973398 Free PMC article.
References
-
- Bellentani S, Saccoccio G, Masutti F, Croce LS, Brandi G, Sasso F, Cristanini G, Tiribelli C. Prevalence of and risk factors for hepatic steatosis in Northern Italy. Ann Intern Med. 2000;132:112–7. - PubMed
LinkOut - more resources
Full Text Sources
Other Literature Sources