. 2006 Jan;140(1):30-48.
doi: 10.1104/pp.105.069690. Epub 2005 Dec 23.

A coumaroyl-ester-3-hydroxylase insertion mutant reveals the existence of nonredundant meta-hydroxylation pathways and essential roles for phenolic precursors in cell expansion and plant growth

Affiliations

A coumaroyl-ester-3-hydroxylase insertion mutant reveals the existence of nonredundant meta-hydroxylation pathways and essential roles for phenolic precursors in cell expansion and plant growth

Nawroz Abdulrazzak et al. Plant Physiol. 2006 Jan.

Erratum in

  • Plant Physiol. 2006 Aug;141(4):1708
  • Plant Physiol. 2007 Apr;143(4):1982

Abstract

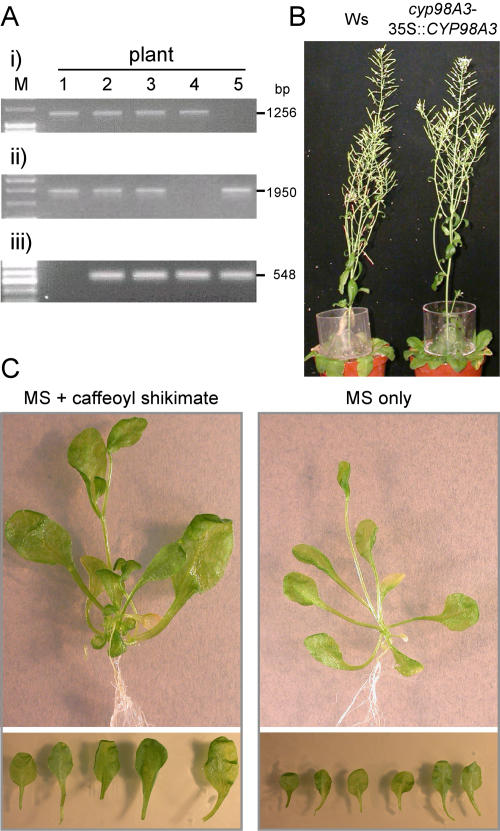
Cytochromes P450 monooxygenases from the CYP98 family catalyze the meta-hydroxylation step in the phenylpropanoid biosynthetic pathway. The ref8 Arabidopsis (Arabidopsis thaliana) mutant, with a point mutation in the CYP98A3 gene, was previously described to show developmental defects, changes in lignin composition, and lack of soluble sinapoyl esters. We isolated a T-DNA insertion mutant in CYP98A3 and show that this mutation leads to a more drastic inhibition of plant development and inhibition of cell growth. Similar to the ref8 mutant, the insertion mutant has reduced lignin content, with stem lignin essentially made of p-hydroxyphenyl units and trace amounts of guaiacyl and syringyl units. However, its roots display an ectopic lignification and a substantial proportion of guaiacyl and syringyl units, suggesting the occurrence of an alternative CYP98A3-independent meta-hydroxylation mechanism active mainly in the roots. Relative to the control, mutant plantlets produce very low amounts of sinapoyl esters, but accumulate flavonol glycosides. Reduced cell growth seems correlated with alterations in the abundance of cell wall polysaccharides, in particular decrease in crystalline cellulose, and profound modifications in gene expression and homeostasis reminiscent of a stress response. CYP98A3 thus constitutes a critical bottleneck in the phenylpropanoid pathway and in the synthesis of compounds controlling plant development. CYP98A3 cosuppressed lines show a gradation of developmental defects and changes in lignin content (40% reduction) and structure (prominent frequency of p-hydroxyphenyl units), but content in foliar sinapoyl esters is similar to the control. The purple coloration of their leaves is correlated to the accumulation of sinapoylated anthocyanins.


Figures

Figure 1.
Figure 1.
The phenylpropanoid pathway and modification occurring as a result of CYP98A3 suppression. The pathways activated in the cyp98A3 mutants are shown in red. The pathways inactivated are shown in gray. The monolignol DCG has been described as a growth regulator (Binns et al., 1987; Tamagnone et al., 1998). Aromatic amino acids, including Phe, are synthesized in the plastids via the so-called shikimate pathway (Herrmann and Weaver, 1999). The mode of transport of shikimate and Phe from the plastids to the cytoplasm is not yet described. 4CL, 4-Hydroxy cinnamoyl-CoA ligase.
Figure 2.
Figure 2.
Characterization of cyp98A3 insertion mutants. A cyp98A3 insertion mutant was isolated by PCR screening of a T-DNA-mutagenized population in the Ws accession. A, Fifteen-day-old seedlings grown on vertical agar plates. Wild-type Ws plants are shown on the left; homozygous cyp98A3 mutants on the right. B, Six-week-old null cyp98A3 insertion plants (bottom) grown on soil compared to wild-type Ws plants (top). C, Fifteen micrograms of total RNA isolated from 15-d-old wild-type Ws and cyp98A3 insertion plants were used for RNA-blot hybridizations using a CYP98A3 radiolabeled probe. No CYP98A3 transcript is detectable in homozygous cyp98A3 insertion mutants.
Figure 3.
Figure 3.
Characterization of cosuppressed cyp98A3 lines. Arabidopsis Col-0 plants were transformed with a 35SCYP98A3 construct. Approximately 10% of primary transformants showed cosuppression of CYP98A3. The phenotypes of selected transformants are shown in A to E (roman numbers identify individual transformants). A, Three-week-old T1 plants grown on vertical agar plates. Wild-type (Col-0) plants are shown on both sides. B to E, Different 10-week-old cosuppressed T1 lines grown on soil (B). Moderately cosuppressed plants arrested at different stages of bolting stem development (C–E). When plants bolted, inflorescences showed purple stems and cauline leaves; they were limp, in most cases male sterile, and rarely produced viable seeds (C and E). Viable seeds were collected from plants V, VI, and VII (B and D) and progeny derived from these lines was used for quantitative real-time RT-PCR. Plants grown for 4 to 10 weeks were used for total RNA isolation. As an internal standard, Actin II was coamplified with the CYP98A3 cDNA and ΔΔCT values are given relative to the expression level observed for wild-type (Col-0) plants at each time point (F). Cosuppression was observed starting at 5 weeks for lines V and VI, and increased over time in all lines until no transcripts were detectable at 10 weeks.
Figure 4.
Figure 4.
Ectopic lignification phenotypes of cyp98A3 insertion and cosuppressed plants. Plant material was stained with phloroglucinol and visualized using whole-mount bright-field microscopy. A, Roots from 3-week-old wild-type (Ws) and cyp98A3 insertion plants (30×). B to E, Different organs from 10-week-old T2 plants derived from the cosuppressed line VII (Fig. 3) were used for phloroglucinol staining. Roots (B, 30×), inflorescence stems (C), cauline leaves (D), and flowers (E, each 10×).
Figure 5.
Figure 5.
HPLC-MS identification of soluble phenolics extracted from cyp98A3 insertion and cosuppressed plants compared to wild type. Fifteen-day-old wild-type Ws (A) and cyp98A3 insertion (B) seedlings were used for MeOH:H2O (4:1) extraction and liquid chromatography. Cauline leaves from 10-week-old wild-type Col-0 (C) and cosuppressed plants (T2 plants derived from lines V, VI, and VII; Fig. 3; D). For MS, the negative electrospray mode was used and ions were detected in the range from 120 m/z to 800 m/z (detection: total ion current, arbitrary unit). See “Materials and Methods” and supplemental text for precise peak identification. IS, Internal standard (morin); K, kaempferol; Q, quercetin; I, isorhamnetin.
Figure 6.
Figure 6.
Modifications in cell size and cell wall polysaccharides in cyp98A3 insertion mutants. A, Reduced epidermal cell size and leaf area in 15-d-old cyp98A3 insertion mutants compared to wild type (Ws). Fully expanded leaves were stained with Hoyer's solution and were used for Normarski optics microscopy (left). Average cell size was determined using 40 leaf areas from 10 plants. Mean cell sizes and sds are shown as bar plots (right). Mean of total leaf area size of wild-type and cyp98A3 insertion plants are shown on the far right. B, Cell wall material was prepared from leaves of 5-week-old cyp98A3 insertion mutants (white bars), 2-week-old wild-type (Ws; gray bars), and 5-week-old wild-type (black bars) plants. Dried cell wall material was used for TFA hydrolysis (representing matrix polysaccharides) and the resulting monosaccharide derivatives were quantified using gas GC-MS. UA content was determined using the metahydroxyl-biphenyl assay (Blumenkrantz and Asboe-Hansen, 1973). Shown at the top are results from three replicates; error bars indicate sds. At the bottom, monosaccharide composition of the crystalline cellulose fraction based on Seaman hydrolysis is shown. Dried cell wall material was hydrolyzed using sulfuric acid and the released monosaccharides were quantified using GC-MS. All amounts are shown in micromoles per milligram of dry cell wall material. C, Roots from 2-week-old seedlings were used for immunostaining using tubulin antibodies. Staining of cortical microtubules in the root elongation zone of wild type (Ws) and the cyp98A3 insertion mutant are shown.
Figure 7.
Figure 7.
Phenylpropanoid gene expression in cyp98A3 insertion and cosuppression mutants. A, Fifteen-day-old cyp98A3 insertion mutant (cyp98A3 null) and wild-type (Ws) plants were harvested at different time points after the onset of light (time 0 h) during a regular 12-h light period as indicated (plants grown on agar plates under 12-h-light/12-h-dark cycle). Total RNA was used for quantitative real-time RT-PCR. As an internal standard, Actin II was coamplified with the PAL1, C4H, HCT, and CYP98A3 cDNA and ΔΔCT values are given relative to the expression level of the respective gene observed for wild-type (Ws) plants at 0 h. B, Ten-week-old cosuppressed T2 Col-0 plants derived from lines V, VI, and VII (Fig. 3) were used for quantitative real-time RT-PCR. Plants were cultivated on soil under a 12-h-light/12-h-dark cycle. Expression levels of each gene are given relative to the respective level observed for wild-type (Col-0) plants at 0 h.
Figure 8.
Figure 8.
Global changes in gene expression in cyp98A3 insertion mutants. Wild-type Ws and cyp98A3 insertion plants grown for 15 d on agar plates were used for total RNA isolation. Microarray analyses were performed using two biological replicates with two technical replicates (dye swaps) each, and the CATMA Arabidopsis near-full genome array. Upon normalization and statistical analysis, 1,889 annotated genes were found to be differentially expressed (Bonferroni-adjusted p [t test] < 0.05). A, Functional grouping of differentially expressed genes that differed in expression more than 3-fold between cyp98A3 insertion mutants and wild-type Ws using the Functional Category Database at MAtDB (Schoof et al., 2002; http://mips.gsf.de/proj/funcatDB). The frequency of up-regulated genes in each functional category (shown as dark-gray bars) was compared to the frequency of all genes represented on the microarray in the same functional category (shown as light-gray bars). Only functional categories that are over-represented (p [hypergeometric distribution] < 0.05) in the group of up-regulated genes are shown. At the bottom, results of the same analysis for 249 genes, which were expressed to more than 3-fold lower levels in cyp98A3 mutants and which were annotated in the Functional Category Database, are shown. B, We retrieved from TAIR (Garcia-Hernandez et al., 2002; http://www.arabidopsis.org/tools/bulk/go) curator-annotated lists of genes that were placed into the GO terms “biosynthesis of,” “signal transduction mediated by,” and “response to” the plant hormones auxin (AUX), abscisic acid (ABA), brassinosteroid (BS), cytokinin (CYT), ethylene (ET), gibberellic acid (GA), jasmonic acid (JA), and salicylic acid (SA). Two asterisks indicate over-represented groups (p [hypergeometric distribution] < 0.01), one asterisk indicates P < 0.05. Shown as stacked bar plots are the frequencies of genes in each group expressed to higher levels in cyp98A3 mutants (on top of the vertical axis, separately for genes changing more [black bars] or less [dark-gray bars] than 2-fold), as well as for genes expressed to lower levels in cyp98A3 insertion plants (below the vertical axis; medium-gray bars indicate less than 2-fold difference, light-gray bars indicate more than 2-fold difference).
Figure 9.
Figure 9.
Genetic and chemical complementation of the cyp98A3 mutation. Heterozygous cyp98A3 insertion plants were transformed with a CaMV 35SCYP98A3 construct, and homozygous cyp98A3 plants in the progeny of BASTA-resistant plants were identified using PCR (A) and (i) a gene-specific (Tuc) and a T-DNA-specific (Lbnes) primer; (ii) two gene-specific primers (Tuc, P2) located on each site of the T-DNA insertion site; and (iii) two 35SCYP98A3 construct-specific primers (A3/Bar). Plant 1, Heterozygous, not transformed; plants 2 and 3, heterozygous, transformed; plant 4, homozygous cyp98A3, transformed; plant 5, homozygous wild type, transformed. B, Impact of the genetic complementation on 10-week-old plants: wild-type Ws (left) and homozygous cyp98A3 insertion mutant transformed with the 35SCYP98A3 construct (right). C, Chemical complementation, Homozygous cyp98A3 insertion mutants grown on Murashige and Skoog medium for 2 weeks were transferred to Murashige and Skoog medium containing 90 μm caffeoyl shikimate and grown for an additional 2 weeks (left). Control plants were transferred to nonsupplemented Murashige and Skoog medium (right).

References

    1. Adler E, Bjorkquist KJ, Haggroth S (1948) Ûber die Ursache der Farbreaktionen des Holzes. Acta Chem Scand 2: 93–94
    1. Albersheim P, Nevins DJ, English PD, Karr A (1967) A method for the analysis of sugars in plant cell-wall polysaccharides by gas-liquid chromatography. Carbohydr Res 5: 340–345
    1. Baskin TI (2001) On the alignment of cellulose microfibrils by cortical microtubules: a review and a model. Protoplasma 215: 150–171 - PubMed
    1. Binns AN, Chen RH, Wood HN, Lynn DG (1987) Cell division promoting activity of naturally occurring dehydrodiconiferyl glucosides: Do cell wall components control cell division? Proc Natl Acad Sci USA 84: 980–984 - PMC - PubMed
    1. Bloor SJ, Abrahams S (2002) The structure of the major anthocyanin in Arabidopsis thaliana. Phytochemistry 59: 343–346 - PubMed

Publication types

MeSH terms

Associated data