. 2006 Jan;80(2):975-84.
doi: 10.1128/JVI.80.2.975-984.2006.

Natural history of human respiratory syncytial virus inferred from phylogenetic analysis of the attachment (G) glycoprotein with a 60-nucleotide duplication

Affiliations

Natural history of human respiratory syncytial virus inferred from phylogenetic analysis of the attachment (G) glycoprotein with a 60-nucleotide duplication

Alfonsina Trento et al. J Virol. 2006 Jan.

Abstract

A total of 47 clinical samples were identified during an active surveillance program of respiratory infections in Buenos Aires (BA) (1999 to 2004) that contained sequences of human respiratory syncytial virus (HRSV) with a 60-nucleotide duplication in the attachment (G) protein gene. This duplication was analogous to that previously described for other three viruses also isolated in Buenos Aires in 1999 (A. Trento et al., J. Gen. Virol. 84:3115-3120, 2003). Phylogenetic analysis indicated that BA sequences with that duplication shared a common ancestor (dated about 1998) with other HRSV G sequences reported worldwide after 1999. The duplicated nucleotide sequence was an exact copy of the preceding 60 nucleotides in early viruses, but both copies of the duplicated segment accumulated nucleotide substitutions in more recent viruses at a rate apparently higher than in other regions of the G protein gene. The evolution of the viruses with the duplicated G segment apparently followed the overall evolutionary pattern previously described for HRSV, and this genotype has replaced other prevailing antigenic group B genotypes in Buenos Aires and other places. Thus, the duplicated segment represents a natural tag that can be used to track the dissemination and evolution of HRSV in an unprecedented setting. We have taken advantage of this situation to reexamine the molecular epidemiology of HRSV and to explore the natural history of this important human pathogen.


Figures
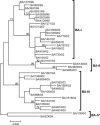
FIG. 1.
FIG. 1.
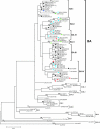
Phylogenetic tree of BA sequences with a 60-nucleotide duplication in the G protein gene. Complete nucleotide sequences of the G protein gene, obtained from 38 clinical samples that yielded a slow migrating DNA band (Table 1), were used to construct the phylogenetic tree by the maximum-likelihood method (see Materials and Methods). The length of horizontal lines is proportional to the genetic distance between viruses. The bar represents 0.002 nucleotide substitutions per site, and the tree is unrooted. Numbers at the internal nodes represent the bootstrap probabilities (500 replicates). Only bootstrap values > 70 are shown. Branches are indicated at the right by brackets. The sequences of three viruses (BA/3833/99, BA/4128/99, and BA/3859/99) have been reported previously (49) and were included here for comparative purposes.
FIG. 2.
FIG. 2.
Phylogenetic tree of HRSV group B constructed by the maximum-likelihood method. A total of 46 partial nucleotide sequences of the G protein gene (nucleotides 652 to 982) with the 60-nucleotide duplication from samples isolated in BA were aligned using the CLUSTAL software. Of these, only 30 were unique sequences (some unique BA sequences of Fig. 1 were identical in the partial segment used here) that were compared with the same segment of unique sequences with the duplication reported from Quebec (QUE), Niigata (NG), Sapporo (SAP), Kenya (Ken), and Belgium (BE). These samples are marked with color-coded diamonds in the figure, according to countries. Partial sequences (nucleotides 652 to 922) of reference group B genotypes GB1, GB2, GB3, GB4, SAB1, SAB2, SAB3, URU1, and URU2 and the reference strain CH18537 were included in the analysis for comparison. The length of horizontal lines is proportional to the genetic distance between viruses. The bar represents one 0.02 nucleotide substitution per site, and the tree was unrooted. The numbers at the internal nodes indicate the number of bootstrap probabilities (500 replicates) (shown only for values > 70). Names of viruses refer to the place/number/year of isolation, when known. Genotypes are indicated at right by brackets. Within BA genotype, branches BA-I to BA-VI are shown also by brackets. The number of BA sequences identical to those shown in the figure is indicated between parentheses at right of the sample name.
FIG. 3.
FIG. 3.
Partial sequences of the G protein gene with the 60-nucleotide duplication. The sequences of samples with the 60-nucleotide duplication used to construct the tree of Fig. 2 were aligned using the CLUSTAL software. Nucleotide sequences are shown at left of the figure, and the translated amino acid sequences are shown at right, with the branch name in the middle. The two copies of the duplicated sequences are framed by rectangles. Identical residues are indicated by dots. The name of samples and the color code are the same as described for Fig. 2. The protein length is shown at the right of each partial amino acid sequence.
FIG. 4.
FIG. 4.
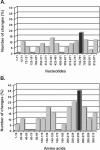
Sequence variation along the G protein gene of BA samples with the 60-nucleotide duplication. (A) The nucleotide sequences of samples shown in Fig. 1 were aligned with the CLUSTAL program. The number of changes found in nonoverlapping windows of 60 nucleotides, framed to match the duplicated segment (note that the first window is narrower than 60 nucleotides), were calculated and expressed as percentages of the window length (ordinates). (B) The same type of analysis was done with the translated amino acid sequences by use of nonoverlapping windows of 20 amino acids framed to match the duplicated sequence. The first copy of the duplication is indicated by black bars.
FIG. 5.
FIG. 5.
Evolutionary rate and date of the most common ancestor of BA sequences with the 60-nucleotide duplication analysis. The root-to-tip distance (p distance; ordinates) of BA sequences from Fig. 1 was plotted against the year of isolation of the different samples (abscissas). A line was drawn by regression analysis, and the root sequence was set to maximize the R2 value of the analysis. The horizontal bar represents the date of the most recent common ancestor formula image estimated by the maximum-likelihood method and the 95% confidence interval.
FIG. 6.
FIG. 6.
Geographical distribution of the BA genotype sequences. The locations from which HRSV G sequences with the duplicated segment have been reported are shown in the map (colored coded as described for Fig. 2), indicating BA branches and isolation years of samples. Samples from India, New York, and Sao Paulo (indicated by empty dots in the map) containing sequences with the 60-nucleotide duplication have been reported in different meetings, but details of those samples are still unavailable. Samples with duplicated G sequences have also been isolated in the United Kingdom (UK; Pat Cane, personal communication).

References

    1. Anderson, L. J., J. C. Hierholzer, C. Tsou, R. M. Hendry, B. F. Fernie, Y. Stone, and K. McIntosh. 1985. Antigenic characterization of respiratory syncytial virus strains with monoclonal antibodies. J. Infect. Dis. 151:626-633. - PubMed
    1. Blanc, A., A. Delfraro, S. Frabasile, and J. Arbiza. 2005. Genotypes of respiratory syncytial virus group B identified in Uruguay. Arch. Virol. 150:603-609. - PubMed
    1. Cane, P. A. 2001. Molecular epidemiology of respiratory syncytial virus. Rev. Med. Virol. 11:103-116. - PubMed
    1. Cane, P. A., D. A. Matthews, and C. R. Pringle. 1994. Analysis of respiratory syncytial virus strain variation in successive epidemics in one city. J. Clin. Microbiol. 32:1-4. - PMC - PubMed
    1. Cane, P. A., and C. R. Pringle. 1995. Evolution of subgroup A respiratory syncytial virus, evidence for progressive accumulation of amino acid changes in the attachment protein. J. Virol. 69:2918-2925. - PMC - PubMed

Publication types

Associated data