

Common MRI acquisition non-idealities significantly impact the output of the boundary shift integral method of measuring brain atrophy on serial MRI
- PMID: 16380273
- PMCID: PMC2751846
- DOI: 10.1016/j.neuroimage.2005.10.049
Common MRI acquisition non-idealities significantly impact the output of the boundary shift integral method of measuring brain atrophy on serial MRI
Abstract
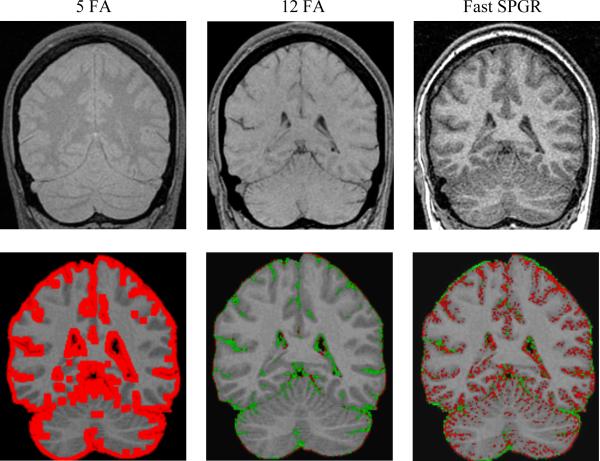
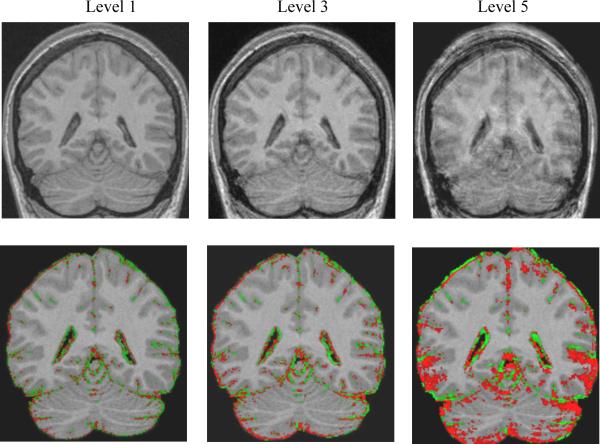
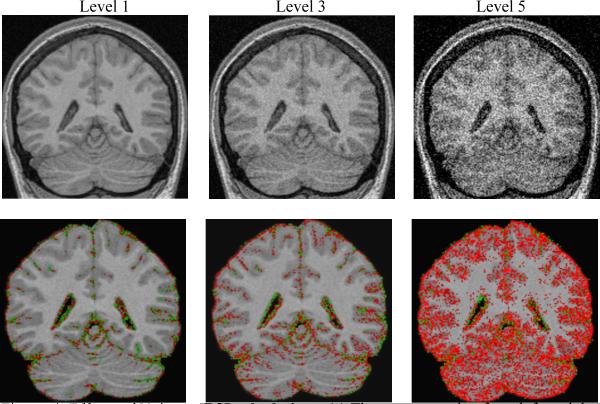
Measuring rates of brain atrophy from serial magnetic resonance imaging (MRI) studies is an attractive way to assess disease progression in neurodegenerative disorders, particularly Alzheimer's disease (AD). A widely recognized approach is the boundary shift integral (BSI). The objective of this study was to evaluate how several common scan non-idealities affect the output of the BSI algorithm. We created three types of image non-idealities between the image volumes in a serial pair used to measure between-scan change: inconsistent image contrast between serial scans, head motion, and poor signal-to-noise (SNR). In theory the BSI volume difference measured between each pair of images should be zero and any deviation from zero should represent corruption of the BSI measurement by some non-ideality intentionally introduced into the second scan in the pair. Two different BSI measures were evaluated, whole brain and ventricle. As the severity of motion, noise, and non-congruent image contrast increased in the second scan, the calculated BSI values deviated progressively more from the expected value of zero. This study illustrates the magnitude of the error in measures of change in brain and ventricle volume across serial MRI scans that can result from commonly encountered deviations from ideal image quality. The magnitudes of some of the measurement errors seen in this study exceed the disease effect in AD shown in various publications, which range from 1% to 2.78% per year for whole brain atrophy and 5.4% to 13.8% per year for ventricle expansion (Table 1). For example, measurement error may exceed 100% if image contrast properties dramatically differ between the two scans in a measurement pair. Methods to maximize consistency of image quality over time are an essential component of any quantitative serial MRI study.
Figures
References
-
- Fox NC, Cousens S, Scahill R, et al. Using serial registered brain magnetic resonance imaging to measure disease progression in Alzheimer disease. Arch Neurol. 2000;57:339–443. - PubMed
-
- Fox NC, Freeborough PA, Rossor MN. Visualization and quantification of rates of atrophy in Alzheimer's disease. The Lancet. 1996;348:94–97. - PubMed
-
- Fox NC, Warrington EK, Rossor MN. Serial magnetic resonance imaging of cerebral atrophy in preclinical Alzheimer's disease. The Lancet. 1999a;353:2125. - PubMed
-
- Fox NC, Scahill RI, Crum WR, Rossor MN. Correlation between rates of brain atrophy and cognitive decline in AD. Neurology. 1999b;52:1687–1689. - PubMed
Publication types
MeSH terms
Grants and funding
LinkOut - more resources
Full Text Sources
Medical
Research Materials
