Comparative Study
. 2006 Jan;55(1):148-57.

Adipose triglyceride lipase: function, regulation by insulin, and comparison with adiponutrin

Affiliations
Comparative Study

Adipose triglyceride lipase: function, regulation by insulin, and comparison with adiponutrin

Erin E Kershaw et al. Diabetes. 2006 Jan.

Abstract

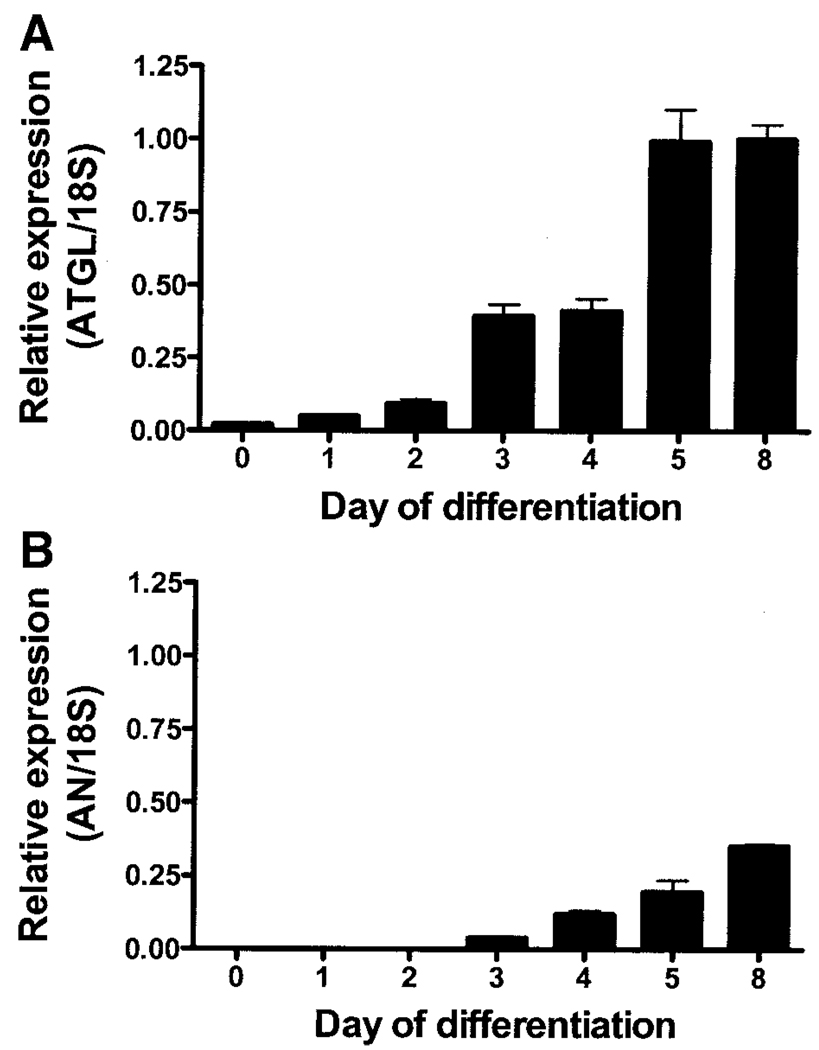
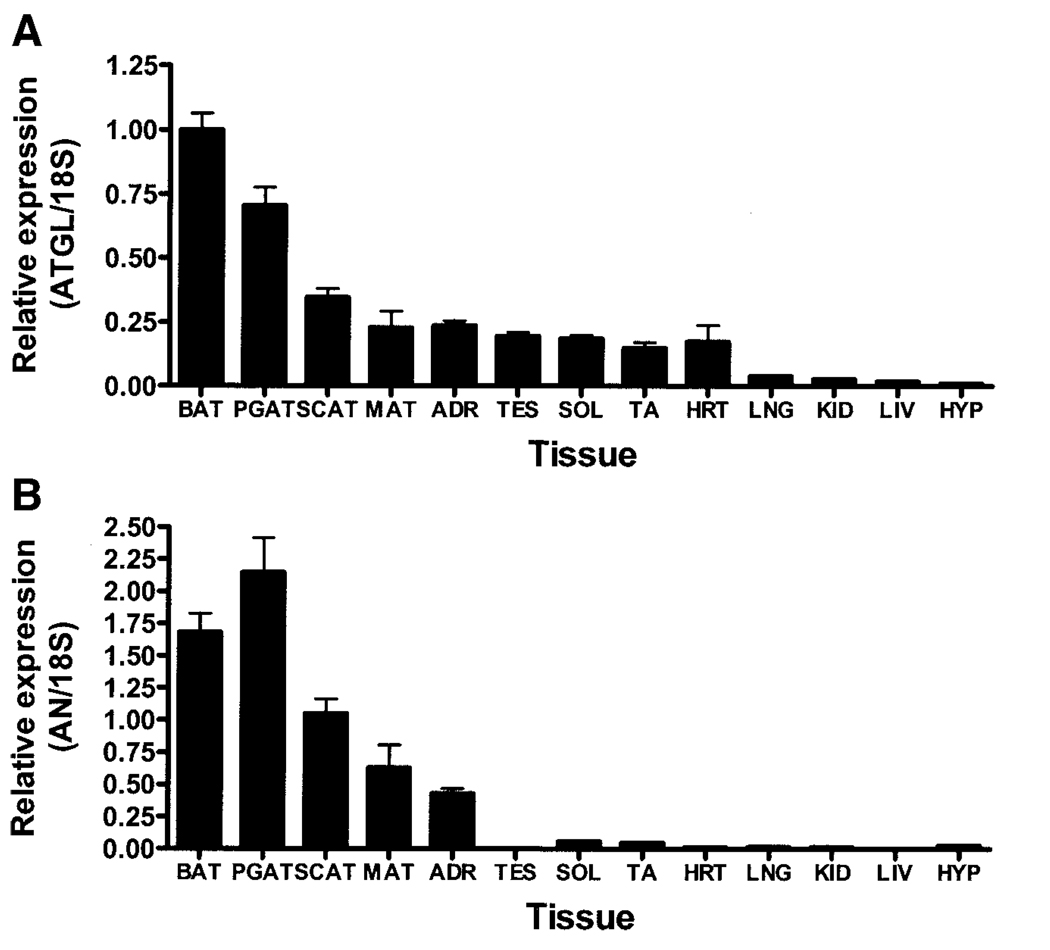
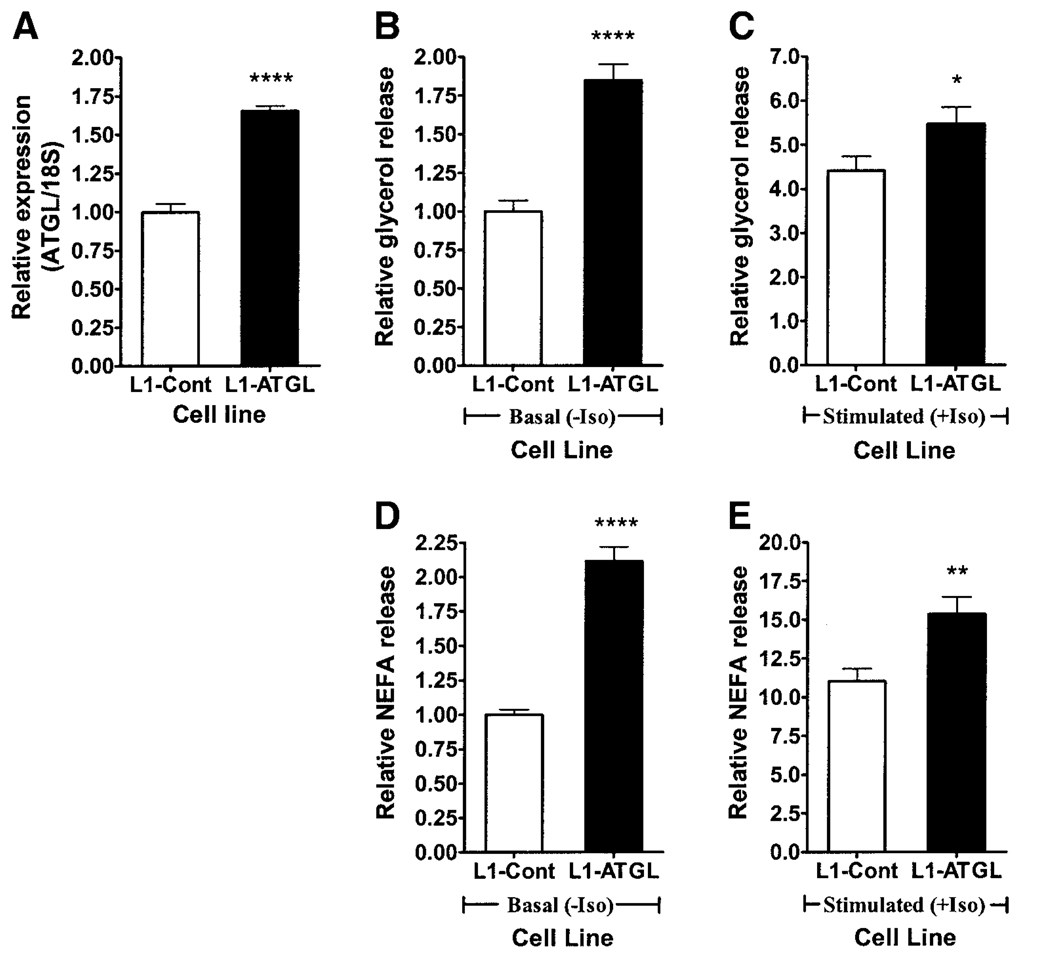
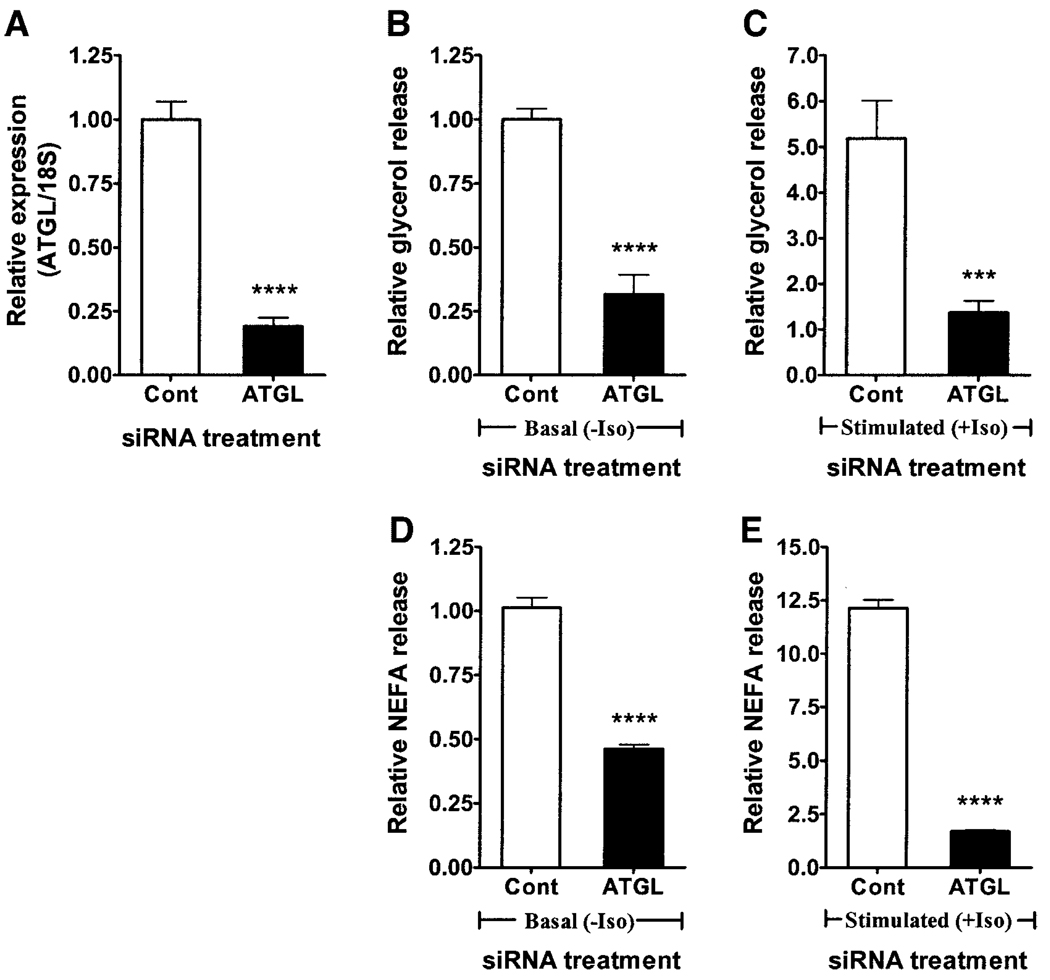
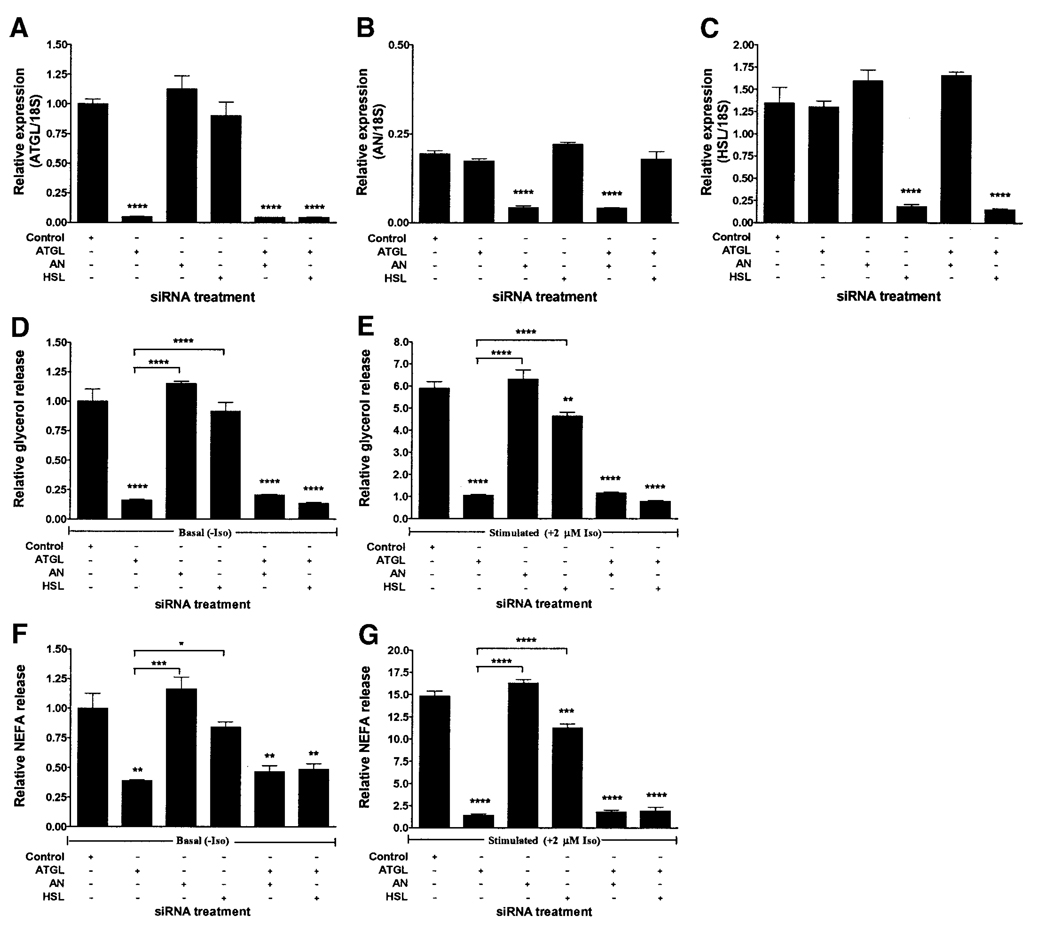
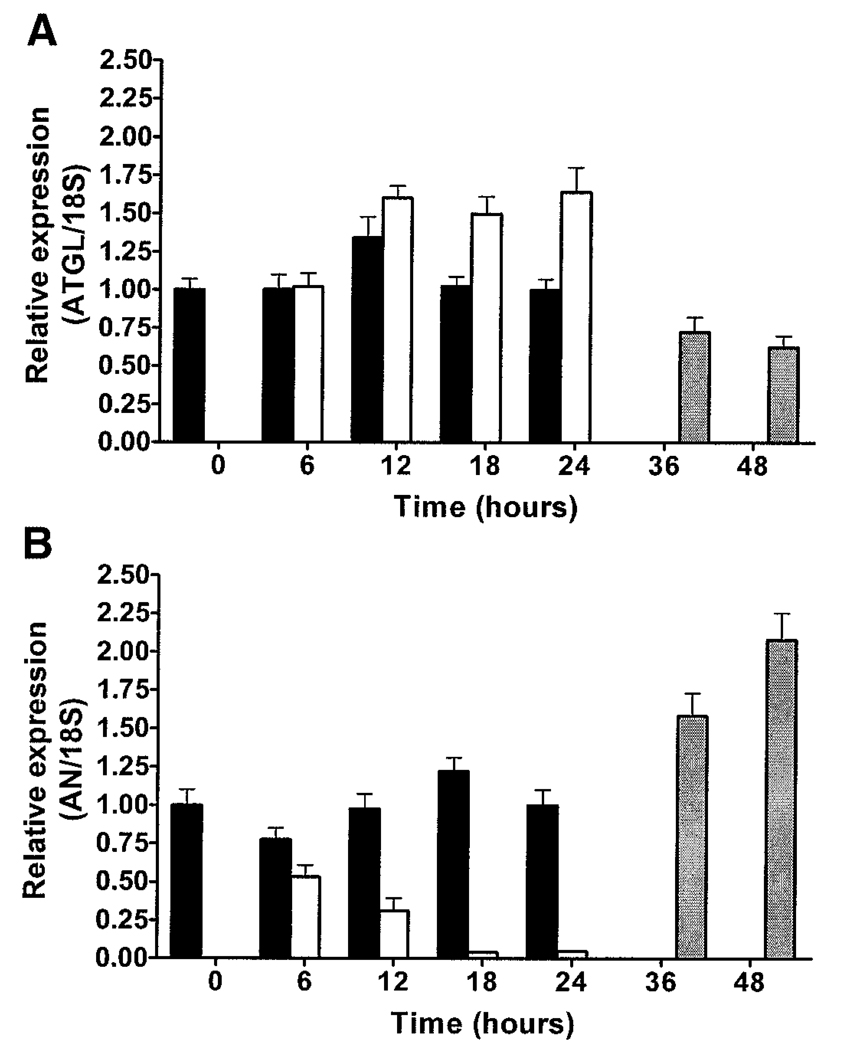
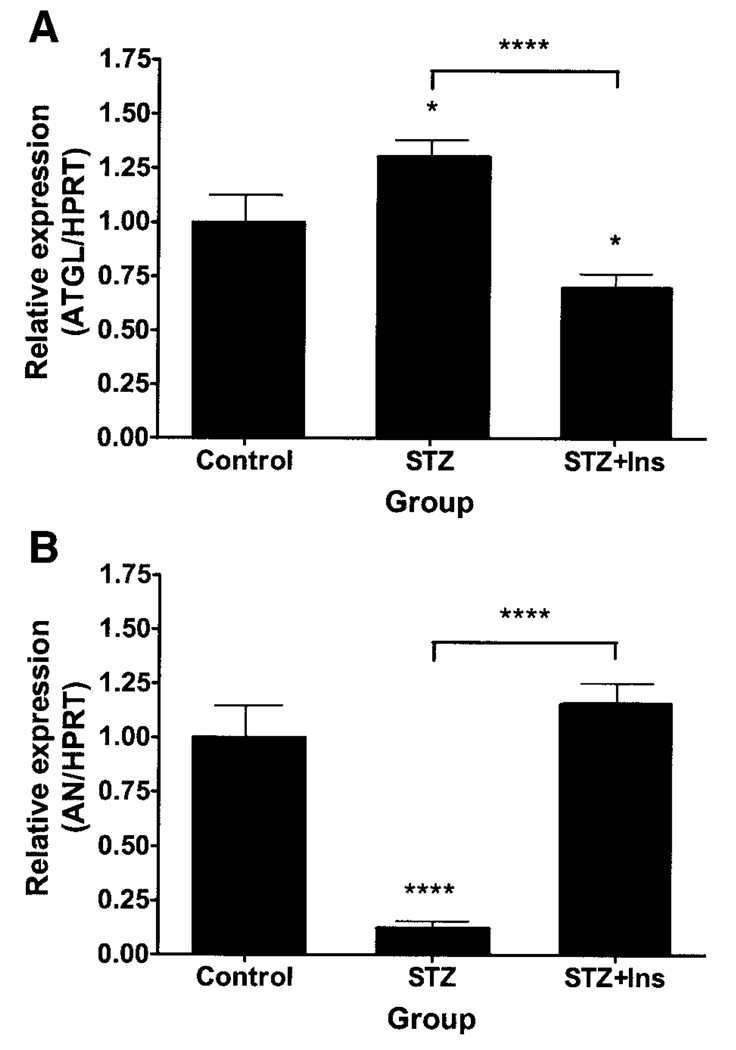
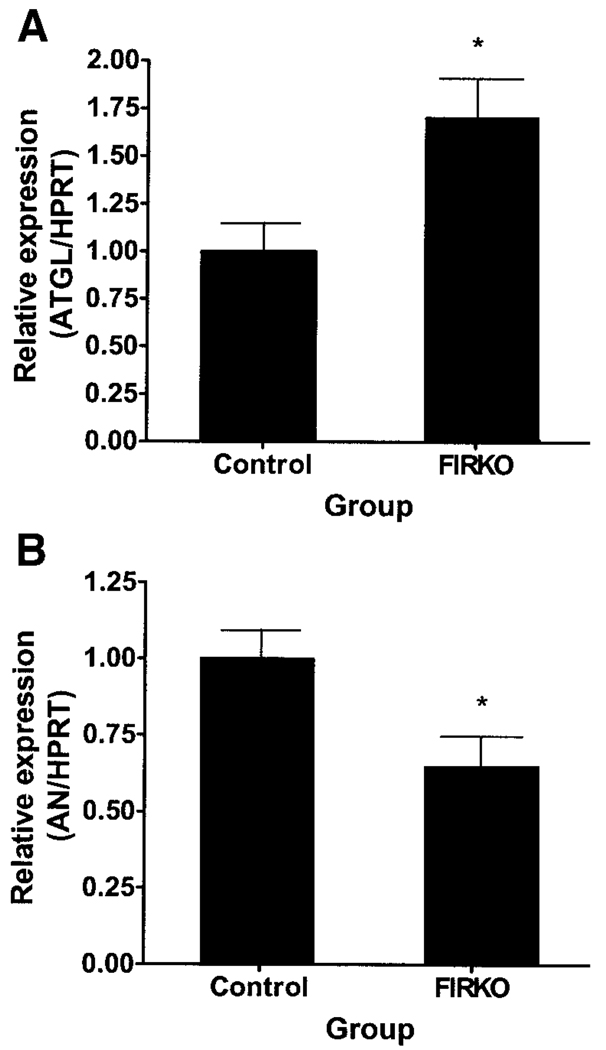
Adipose triglyceride lipase (ATGL) is a recently described adipose-enriched protein with triglyceride-specific lipase activity. ATGL shares the greatest sequence homology with adiponutrin, a nutritionally regulated protein of unclear biological function. Here we present a functional analysis of ATGL and adiponutrin and describe their regulation by insulin. Retroviral-mediated overexpression of ATGL in 3T3-L1 adipocytes increased basal and isoproterenol-stimulated glycerol and nonesterified fatty acid (NEFA) release, whereas siRNA-mediated knockdown of ATGL had the opposite effect. In contrast, siRNA-mediated knockdown of adiponutrin in 3T3-L1 adipocytes had no effect on glycerol or NEFA release. In mice, both ATGL and adiponutrin are nutritionally regulated in adipose tissue, with ATGL being upregulated and adiponutrin being downregulated by fasting. In 3T3-L1 adipocytes, insulin decreased ATGL and increased adiponutrin expression in a dose- and time-dependent manner, suggesting that insulin directly mediates this nutritional regulation. In addition, adipose expression of ATGL was increased by insulin deficiency and decreased by insulin replacement in streptozotocin-induced diabetic mice and was increased in fat-specific insulin receptor knockout mice, whereas adiponutrin showed the opposite pattern. These data suggest that murine ATGL but not adiponutrin contributes to net adipocyte lipolysis and that ATGL and adiponutrin are oppositely regulated by insulin both in vitro and in vivo.


Figures

FIG. 1
FIG. 1
ATGL and adiponutrin (AN) expression during adipogenesis. ATGL (A) and adiponutrin (B) expression were determined by Q-PCR in 3T3-L1 adipocytes on days 0, 2, 3, 4, 5, and 8 of differentiation (n = 3 per time point). Gene expression was normalized to 18S ribosomal RNA and expressed relative to ATGL expression in day 8 adipocytes.
FIG. 2
FIG. 2
ATGL and adiponutrin (AN) expression in various murine tissues. ATGL (A) and adiponutrin (B) expression were determined by Q-PCR in BAT, PGAT, subcutaneous adipose tissue (SCAT), mesenteric adipose tissue (MAT), adrenal gland (ADR), testes (TES), soleus (SOL), tibialis anterior (TA), heart (HRT), lung (LNG), kidney (KID), liver (LIV), and hypothalamus (HYP) of 10-week-old male C57BL/6J mice (n = 6 per group). Gene expression was normalized to 18S ribosomal RNA and expressed relative to ATGL expression in BAT.
FIG. 3
FIG. 3
Overexpression of ATGL in 3T3-L1 adipocytes. Retroviral-mediated overexpression of ATGL in 3T3-L1 adipocytes was achieved via stable transfection with vector alone (L1-Cont) or vector containing full-length ATGL cDNA (L1-ATGL) (three experiments, n = 3 each). ATGL expression (A), basal (B) and stimulated (C) glycerol release, and basal (D) and stimulated (E) NEFA release were then evaluated at day 4 of differentiation. Gene expression was normalized to 18S ribosomal RNA and expressed relative to ATGL expression in the control group. Glycerol and NEFA release were normalized to total cellular protein and expressed relative to the nonstimulated control group. Iso, isoproterenol. *P < 0.05; **P < 0.01; ****P < 0.0001.
FIG. 4
FIG. 4
Knockdown of ATGL in 3T3-L1 adipocytes. siRNA-mediated knockdown of ATGL in 3T3-L1 adipocytes was achieved by electroporating 3T3-L1 adipocytes with either control siRNA (Cont) or ATGL-specific siRNA (ATGL) at day 4 of differentiation (three experiments, n = 3 each). ATGL expression (A), basal (B) and stimulated (C) glycerol release, and basal (D) and stimulated (E) NEFA release were then evaluated at day 6 of differentiation. Gene expression was normalized to 18S ribosomal RNA and expressed relative to ATGL expression in the control group. Glycerol and NEFA release were normalized to total cellular protein and expressed relative to the nonstimulated control group. Iso, isoproterenol. ***P < 0.001; ****P < 0.0001.
FIG. 5
FIG. 5
Comparison of siRNA-mediated knockdown of ATGL, adiponutrin (AN), and HSL in fully differentiated 3T3-L1 adipocytes. 3T3-L1 adipocytes were electroporated in the presence of control siRNA or siRNAs specific for ATGL, adiponutrin, or HSL, alone or in combination at day 7 of differentiation (n = 3, representative one of two experiments). ATGL (A), adiponutrin (B), and HSL (C) expression were determined by Q-PCR 48 h later. Gene expression was normalized to 18S ribosomal RNA and expressed relative to ATGL expression in the control group. Basal (D) and stimulated (E) glycerol release and basal (F) and stimulated (G) NEFA release were determined at day 9 of differentiation. Glycerol and NEFA release was normalized to total cell protein and expressed relative to the nonstimulated control group. Iso, isoproterenol. *P < 0.05; **P < 0.01; ***P < 0.001; **** P < 0.0001.
FIG. 6
FIG. 6
Regulation of ATGL and adiponutrin (AN) expression by nutritional status. ATGL (A) and adiponutrin (B) mRNA expression were determined by Q-PCR in PGAT of 8-week-old male FVB mice that were fed ad libitum (■), fasted (6, 12, 18, or 24 h) (□), or re-fed (12 or 24 h after a 24-h fast) (formula image) (n = 10 per group) with the onset of the light cycle (6:00
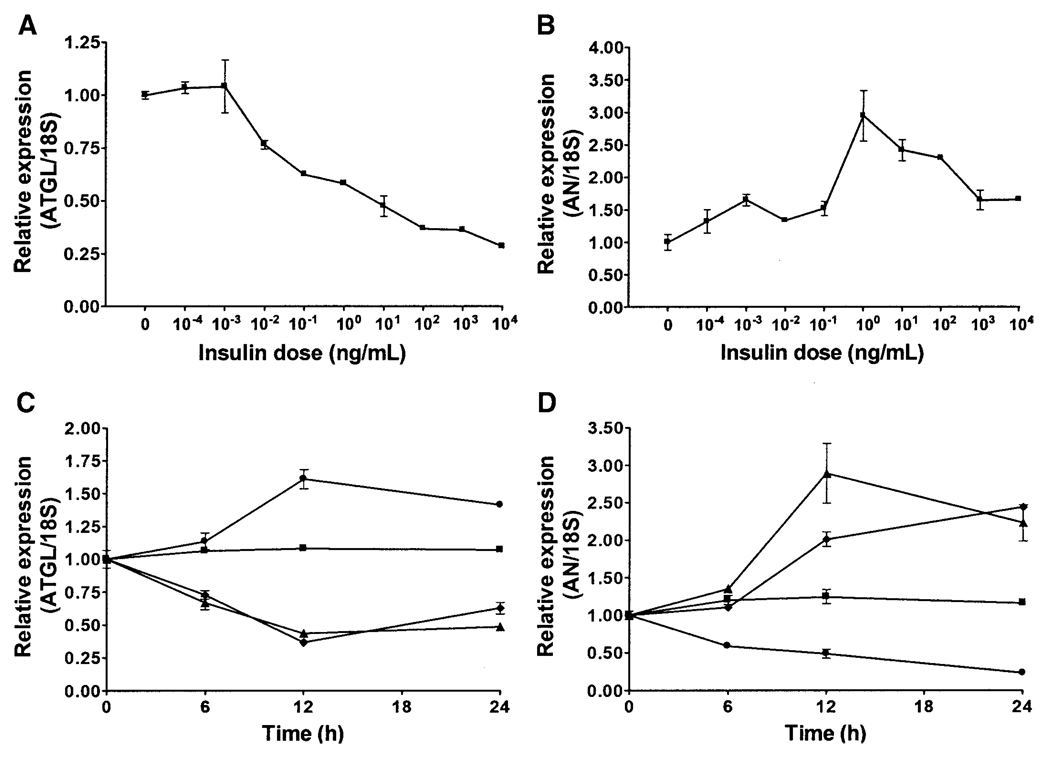
 a.m.) as time 0. Gene expression was normalized to 18S ribosomal RNA and expressed relative to gene expression in ad libitum–fed control mice at time 0.
FIG. 7
FIG. 7
Regulation of ATGL and adiponutrin (AN) expression by insulin in 3T3-L1 adipocytes. Dose-response curves for ATGL (A) and adiponutrin (B) expression were generated by incubating fully differentiated 3T3-L1 adipocytes in serum-free DMEM supplemented with insulin at the doses indicated for 12 h (n = 3, representative one of three experiments). Data were normalized to 18S ribosomal RNA and expressed relative to gene expression in control cells incubated without insulin. Time course for ATGL (C) and adiponutrin (D) expression were generated by incubating fully differentiated 3T3-L1 adipocytes in either DMEM containing 10% FBS or serum-free DMEM (serum starved) with and without insulin at 1,000 ng/ml for ATGL or 1 ng/ml for adiponutrin for the time indicated (n = 3, representative one of three experiments). ■, FBS; ●, serum starved; ♦, FBS plus insulin; ▲, serum starved plus insulin. Data were normalized to 18S and expressed relative to gene expression in the control group at time 0. To convert ng/ml to nmol/l, multiply by 0.174.
FIG. 8
FIG. 8
ATGL and adiponutrin (AN) expression in adipose tissue of STZ-administered mice. ATGL (A) and adiponutrin (B) expression were determined by Q-PCR in PGAT of ad libitum–fed, 10-week-old male mice given vehicle (control), STZ, or STZ followed by insulin replacement for 24 h (STZ + Ins) (n = 8–10 per group). Data were normalized to HPRT and expressed relative to gene expression in the control group. *P < 0.05; ****P < 0.0001.
FIG. 9
FIG. 9
ATGL and adiponutrin (AN) expression in adipose tissue of FIRKO mice. ATGL (A) and adiponutrin (B) expression were determined by Q-PCR in PGAT of 2-year-old, ad libitum–fed, male FIRKO mice (n = 4 per group). Data were normalized to HPRT and expressed relative to gene expression in the control group. *P < 0.05.

References

    1. Holm C. Molecular mechanisms regulating hormone-sensitive lipase and lipolysis. Biochem Soc Trans. 2003;31:1120–1124. - PubMed
    1. Kraemer FB, Shen WJ. Hormone-sensitive lipase: control of intracellular tri-(di-)acylglycerol and cholesteryl ester hydrolysis. J Lipid Res. 2002;43:1585–1594. - PubMed
    1. Yeaman SJ. Hormone-sensitive lipase: new roles for an old enzyme. Biochem J. 2004;379:11–22. - PMC - PubMed
    1. Osterlund T. Structure-function relationships of hormone-sensitive lipase. Eur J Biochem. 2001;268:1899–1907. - PubMed
    1. Shakur Y, Holst LS, Landstrom TR, Movsesian M, Degerman E, Manganiello V. Regulation and function of the cyclic nucleotide phosphodiesterase (PDE3) gene family. Prog Nucleic Acid Res Mol Biol. 2001;66:241–277. - PubMed

Publication types