. 2005 Dec;77(6):1102-11.
doi: 10.1086/498619. Epub 2005 Nov 2.

Genomewide scan and fine-mapping linkage studies in four European samples with bipolar affective disorder suggest a new susceptibility locus on chromosome 1p35-p36 and provides further evidence of loci on chromosome 4q31 and 6q24

Affiliations

Genomewide scan and fine-mapping linkage studies in four European samples with bipolar affective disorder suggest a new susceptibility locus on chromosome 1p35-p36 and provides further evidence of loci on chromosome 4q31 and 6q24

Johannes Schumacher et al. Am J Hum Genet. 2005 Dec.

Abstract

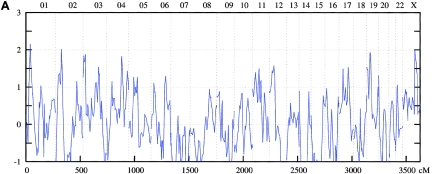
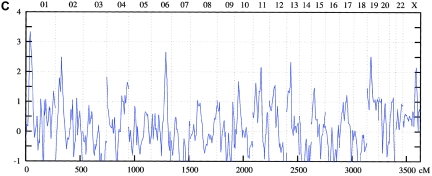
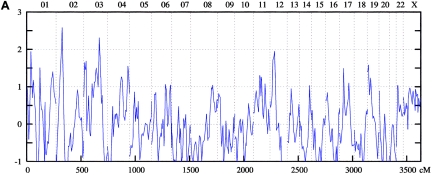
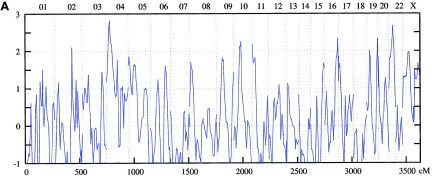
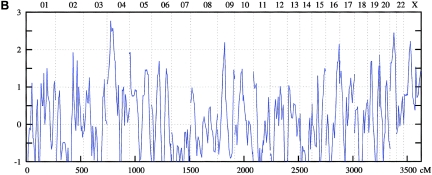
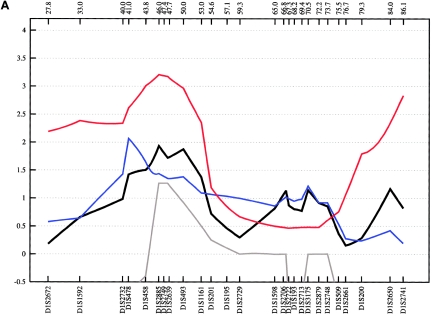
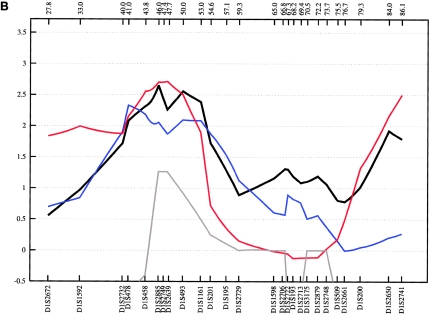
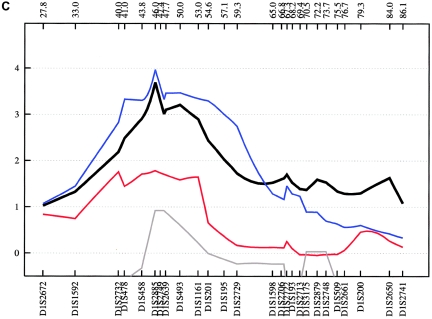
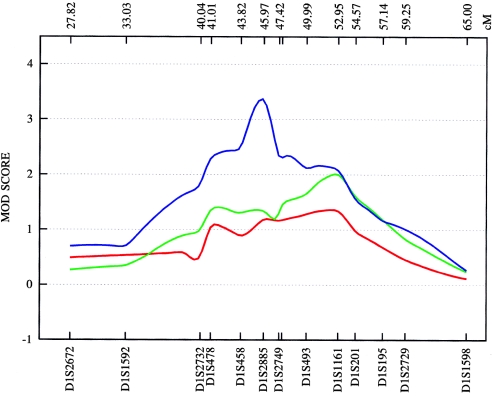
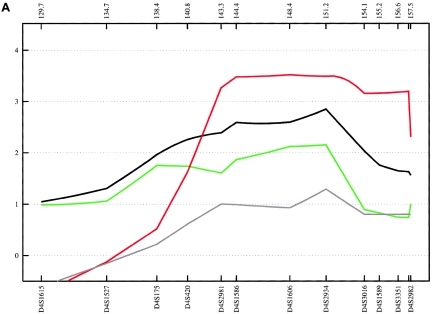
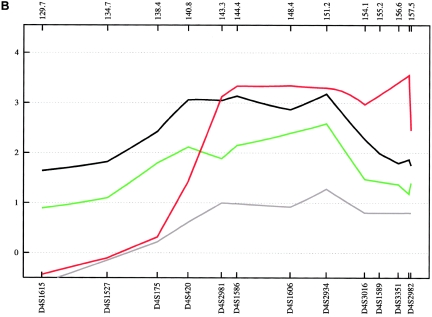
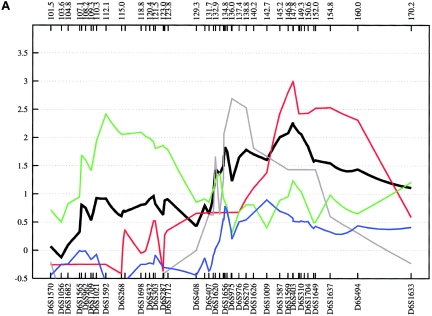
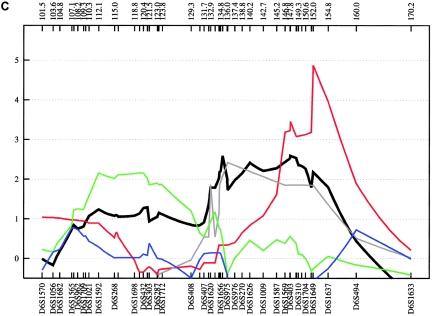
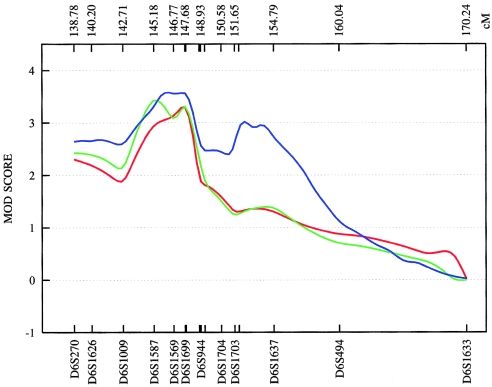
We present the findings of a large linkage study of bipolar affective disorder (BPAD) that involved genomewide analysis of 52 families (448 genotyped individuals) of Spanish, Romany, and Bulgarian descent and further fine mapping of the 1p34-p36, 4q28-q31, and 6q15-q24 regions. An additional sample of 56 German families (280 individuals) was included for this fine-mapping step. The highest nonparametric linkage scores obtained in the fine mapping were 5.49 for 4q31 and 4.87 for 6q24 in the Romany families and 3.97 for 1p35-p36 in the Spanish sample. MOD-score (LOD scores maximized over genetic model parameters) analysis provided significant evidence of linkage to 4q31 and at least borderline significance for the 1p and 6q regions. On the basis of these results and previous positive research findings, 4q31 and 6q24 should now be considered confirmed BPAD susceptibility loci, and 1p35-p36 is proposed as a new putative locus that requires confirmation in replication studies.


Figures

Figure  1
Figure 1
Genomewide scan: multipoint NPL analysis of ASDI (A), ASDII (B), and ASDIII (C), across all chromosomes in the entire linkage sample.
Figure  1
Figure 1
Genomewide scan: multipoint NPL analysis of ASDI (A), ASDII (B), and ASDIII (C), across all chromosomes in the entire linkage sample.
Figure  1
Figure 1
Genomewide scan: multipoint NPL analysis of ASDI (A), ASDII (B), and ASDIII (C), across all chromosomes in the entire linkage sample.
Figure  2
Figure 2
Genomewide scan: multipoint NPL analysis of ASDI (A), ASDII (B), and ASDIII (C), across all chromosomes in the Spanish linkage sample.
Figure  2
Figure 2
Genomewide scan: multipoint NPL analysis of ASDI (A), ASDII (B), and ASDIII (C), across all chromosomes in the Spanish linkage sample.
Figure  2
Figure 2
Genomewide scan: multipoint NPL analysis of ASDI (A), ASDII (B), and ASDIII (C), across all chromosomes in the Spanish linkage sample.
Figure  3
Figure 3
Genomewide scan: multipoint NPL analysis of ASDI (A), ASDII (B), and ASDIII (C), across all chromosomes in the Romany linkage sample.
Figure  3
Figure 3
Genomewide scan: multipoint NPL analysis of ASDI (A), ASDII (B), and ASDIII (C), across all chromosomes in the Romany linkage sample.
Figure  3
Figure 3
Genomewide scan: multipoint NPL analysis of ASDI (A), ASDII (B), and ASDIII (C), across all chromosomes in the Romany linkage sample.
Figure  4
Figure 4
Genomewide scan: multipoint NPL analysis of ASDI (A), ASDII (B), and ASDIII (C), across all chromosomes in the Bulgarian linkage sample.
Figure  4
Figure 4
Genomewide scan: multipoint NPL analysis of ASDI (A), ASDII (B), and ASDIII (C), across all chromosomes in the Bulgarian linkage sample.
Figure  4
Figure 4
Genomewide scan: multipoint NPL analysis of ASDI (A), ASDII (B), and ASDIII (C), across all chromosomes in the Bulgarian linkage sample.
Figure  5
Figure 5
Fine-mapping linkage analysis: chromosomal 1p34-p36 multipoint NPL results in the fine-mapping sample (black) and in the Spanish (blue), Romany (red), and Bulgarian (gray) subsamples of ASDI (A), ASDII (B), and ASDIII (C). Distances on the X-axis are in centimorgans and are determined from the deCODE Genetics sex-averaged map.
Figure  6
Figure 6
Plot of the MOD score for chromosome 1p35-p36, with a separate maximization over trait-model parameters for each genetic position assumed for the trait locus. ASDI (red) position of the maximum MOD score: 52.34 cM; penetrances {0.00; 0.49; 0.49}; disease-allele frequency 0.050. ASDII (green) position of the maximum MOD score: 52.63 cM; penetrances {0.00; 0.50; 0.50}; disease-allele frequency 0.040. ASDIII (blue) position of the maximum MOD score: 45.95 cM; penetrances {0.00; 0.53; 0.53}; disease-allele frequency 0.160. MOD scores are determined from the deCODE Genetics sex-averaged map. The penetrance of the disease models is obtained by MOD-score analysis and given in order {f+/+; fm/+; fm/m}. A plus sign (+) indicates the wild-type allele; “m” indicates the mutant allele.
Figure  7
Figure 7
Fine-mapping linkage analysis: chromosomal 4q28-4q31 multipoint NPL results in the fine-mapping sample (black) and in the German (green), Romany (red), and Bulgarian (gray) subsamples of ASDI (A), ASDII (B), and ASDIII (C). Distances on the X-axis are in centimorgans and are determined from the deCODE Genetics sex-averaged map.
Figure  8
Figure 8
Plot of the MOD score for chromosome 4q31, with a separate maximization over trait-model parameters for each genetic position assumed for the trait locus. ASDI (red) position of the maximum MOD score: 147.64 cM; penetrances {0.00; 0.30; 0.92}; disease-allele frequency 0.025. ASDII (green) position of the maximum MOD score: 147.23 cM; penetrances {0.00; 0.33; 0.99}; disease-allele frequency 0.045. ASDIII (blue) position of the maximum MOD score: 148.44 cM; penetrances {0.00; 0.49; 0.96}; disease-allele frequency 0.040. MOD scores are determined from the deCODE Genetics sex-averaged map. The penetrance of the disease models is obtained by MOD-score analysis and given in order {f+/+; fm/+; fm/m}. A plus sign (+) indicates the wild-type allele; “m” indicates the mutant allele.
Figure  9
Figure 9
Fine-mapping linkage analysis: chromosomal 6q15-q24 multipoint NPL results in the fine-mapping sample (black) and in the German (green), Romany (red), Spanish (blue), and Bulgarian (gray) subsamples of ASDI (A), ASDII (B), and ASDIII (C). Distances on the X-axis are in centimorgans and are determined from the deCODE Genetics sex-averaged map.
Figure  10
Figure 10
Plot of the MOD score for chromosome 6q24, with a separate maximization over trait-model parameters for each genetic position assumed for the trait locus. ASDI (red) position of the maximum MOD score: 147.68 cM; penetrances {0.00; 0.50; 0.50}; disease-allele frequency 0.005. ASDII (green) position of the maximum MOD score: 145.18 cM; penetrances {0.00; 0.52; 0.52}; disease-allele frequency 0.010. ASDIII (blue) position of the maximum MOD score: 146.13 cM; penetrances {0.00; 0.11; 0.26}; disease-allele frequency 0.005. MOD scores are determined from the deCODE Genetics sex-averaged map. The penetrance of the disease models is obtained by MOD-score analysis and given in order {f+/+; fm/+; fm/m}. A plus sign (+) indicates the wild-type allele; “m” indicates the mutant allele.

References

Web Resources

    1. deCODE Genetics, http://www.decode.com/ (for information about the genetic map)
    1. NCBI, http://www.ncbi.nih.gov/ (for BPAD)
    1. Online Mendelian Inheritance in Man (OMIM), http://www.ncbi.nlm.nih.gov/Omim/ (for BPAD) - PubMed
    1. UCSC Genome Bioinformatics, http://genome.ucsc.edu/ (for marker positions and the RefSeq Genes track)

References

    1. Abecasis GR, Cherny SS, Cookson WO, Cardon LR (2002) Merlin—rapid analysis of dense genetic maps using sparse gene flow trees. Nat Genet 30:97–100110.1038/ng786 - DOI - PubMed
    1. American Psychiatric Association (1994) DSM-IV: diagnostic and statistical manual of mental disorders, 4th ed. American Psychiatric Association, Washington, DC
    1. Badner JA, Gershon ES (2002) Meta-analysis of whole-genome linkage scans of bipolar disorder and schizophrenia. Mol Psychiatry 7:405–41110.1038/sj.mp.4001012 - DOI - PubMed
    1. Björnsson Á, Gudmundsson G, Gudfinnsson E, Hrafnsdóttir M, Benedikz J, Skúladóttir S, Kristjánsson K, Frigge ML, Kong A, Stefánsson K, Gulcher JR (2003) Localization of a gene for migraine without aura to chromosome 4q21. Am J Hum Genet 73:986–993 (erratum 76:715) - PMC - PubMed
    1. Cichon S, Schumacher J, Müller DJ, Hürter M, Windemuth C, Strauch K, Hemmer S, et al (2001) A genome screen for genes predisposing to bipolar affective disorder detects a new susceptibility locus on 8q. Hum Mol Genet 25:2933–294410.1093/hmg/10.25.2933 - DOI - PubMed

Publication types

Substances

LinkOut - more resources