. 2005 Dec;103(6):1035-45.
doi: 10.3171/jns.2005.103.6.1035.

Local distribution and toxicity of prolonged hippocampal infusion of muscimol

Affiliations

Local distribution and toxicity of prolonged hippocampal infusion of muscimol

John D Heiss et al. J Neurosurg. 2005 Dec.

Abstract

Object: The activity of gamma-aminobutyric acid (GABA), the principal inhibitory neurotransmitter, is reduced in the hippocampus in patients with complex partial seizures from mesial temporal sclerosis. To provide preliminary safety and distribution data on using convection-enhanced delivery of agents to treat complex partial seizures and to test the efficacy and safety of regional selective neuronal suppression, the authors infused muscimol, a GABA-A receptor agonist, directly into the hippocampus of nonhuman primates using an integrated catheter electrode.

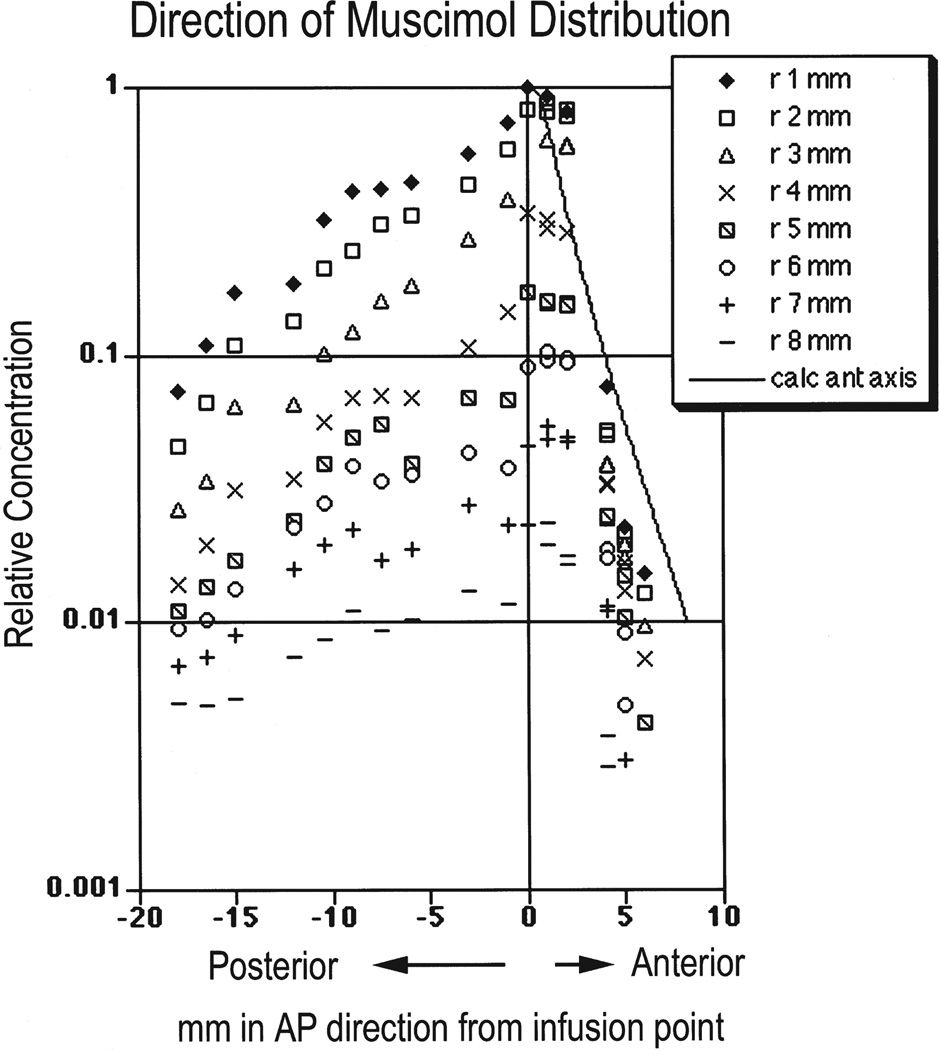
Methods: Ten rhesus monkeys were divided into three groups: 1) use of catheter electrode alone (four monkeys); 2) infusion of escalating concentrations of muscimol followed by vehicle (three monkeys); and 3) infusion of vehicle and subsequent muscimol mixed with muscimol tracer (three monkeys). Infusions were begun 5 days after catheter electrode placement and continued for 5.6 days before switching to the other agent. Head magnetic resonance (MR) images and electroencephalography recordings were obtained before and during the infusions. Brain histological studies and quantitative autoradiography were performed. Neurological function was normal in controls and when muscimol concentrations were 0.125 mM or less, whereas higher concentrations (0.5 and 1 mM) produced reversible apathy and somnolence. Fluid distribution was demonstrated on MR images and muscimol distribution was demonstrated on autoradiographs throughout the hippocampus and adjacent white matter.

Conclusions: Targeted modulation of neuronal activity is a reasonable research strategy for the investigation and treatment of medically intractable epilepsy.


Figures

Fig. 1
Fig. 1
a: Parasagittal T1-weighted MR image demonstrating the catheter electrode as a black line with nodal enlargements at the electrode contacts. The apparent size of the electrodes is magnified on these images because of the metal within them. The tip of the perfusion catheter extends 4 mm beyond the deepest electrode and is not seen because of its small size (outer diameter 0.355 mm). b: Parasagittal T2-weighted image exhibiting the increased signal from the infusate (originating at the tip of the catheter), which displays the distribution of the infusate in the hippocampus and the adjacent white matter.
Fig. 2
Fig. 2
Bar graph depicting the results of FLAIR MR images used to evaluate the effects of the catheter electrode and infusion on brain volume containing an increased water signal. The volume of brain affected by infusion in the temporal lobe far exceeded the volume affected by placement of the catheter electrode (p = 0.001, Day 10; p = 0.001, Day 16; analysis of variance). The infusion groups do not include a measurement on Day 4 because infusions began 5 days after the catheter electrode was implanted. The § symbol indicates that the water signal was not increased in that brain region during the indicated period.
Fig. 3
Fig. 3
Animal 4. Coronal T2-weighted MR images of the brain in an animal whose infusion was stopped 16 days after surgery. During infusion (a and c), the water signal produced by infusion of the temporal lobe parenchyma was increased. By 24 hours after the end of the infusion (b and d) the brain appears normal and the increase in the water signal has resolved completely.
Fig. 4
Fig. 4
Graph depicting the power spectral EEG recordings obtained on different nights during infusion of muscimol, during infusion of vehicle, or before infusion. Muscimol reduces EEG power compared with the power with either vehicle or no infusion.
Fig. 5
Fig. 5
Photographs of brain sections demonstrating where the infusion catheter (arrows) had been left in place, passing to the hippocampus (a and b) from the posterior temporal lobe white matter (c). Photomicrograph (d) of the region where the infusion catheter had been removed demonstrating a narrow zone of tissue necrosis and gliosis around the tip of the catheter electrode (arrow). Identical changes were observed in animals without muscimol infusion. H & E, original magnification × 10 (d).
Fig. 6
Fig. 6
Several T2-weighted MR images and brain autoradiographs comparing coronal tissue sections. The part of the temporal lobe with increased fluid signal (white area) on the T2-weighted MR images corresponds to the part with the highest concentration of muscimol (dark gray area) on the autoradiographs.
Fig. 7
Fig. 7
Graph depicting the distribution of muscimol around the catheter (discrete data points). Concentration is expressed relative to its tissue value immediately adjacent to the tip and shown as a function of the AP distance from the catheter tip. The r values refer to radii within a given transverse plane. The solid curve is the radial concentration profile computed from the convection-diffusion-permeation-reaction equation in spherical coordinates (with an effective hemispheric inflow rate of 0.1 µl/minute) and applied to the region anterior to the catheter tip. It corresponds to concentration data points lying along the anterior extension of the catheter axis and approximates the experimental values at r = 1 mm. Calc ant = calculated anterior.
Fig. 8
Fig. 8
Graph demonstrating the radial concentration profile of muscimol in transverse sections most posterior to the catheter tip (AP = −18 to −15 mm), with concentration expressed relative to its value at r = 1 mm from the catheter (discrete data points). The solid curve is the corresponding concentration computed from the diffusion-permeation-reaction equation in cylindrical coordinates and applied to the transverse plane (Equation 2).

Similar articles

Cited by

References

    1. Alvarez-Royo P, Clower RP, Zola-Morgan S, Squire LR. Stereotaxic lesions of the hippocampus in monkeys: determination of surgical coordinates and analysis of lesions using magnetic resonance imaging. J Neurosci Methods. 1991;38:223–232. - PubMed
    1. Baraczka K, Sperk G. Measurement of gamma-aminobutyric acid in human cerebrospinal fluid: radioreceptor assay using [3H] muscimol. Clin Chim Acta. 1991;109:77–82. - PubMed
    1. Baraldi M, Grandison L, Guidotti A. Distribution and metabolism of muscimol in the brain and other tissues of the rat. Neuropharmacology. 1979;18:57–62. - PubMed
    1. Bird RB, Stewart WE, Lightfoot EN. Transport Phenomena. New York: John Wiley & Sons; 1960.
    1. Bobo RH, Laske DW, Akbasak A, Morrison PF, Dedrick RL, Oldfield EH. Convection-enhanced delivery of macromolecules in the brain. Proc Natl Acad Sci U S A. 1994;91:2076–2080. - PMC - PubMed

MeSH terms