. 2006 Mar;17(3):1194-203.
doi: 10.1091/mbc.e05-07-0643. Epub 2005 Dec 28.

Cdc42 and actin control polarized expression of TI-VAMP vesicles to neuronal growth cones and their fusion with the plasma membrane

Affiliations

Cdc42 and actin control polarized expression of TI-VAMP vesicles to neuronal growth cones and their fusion with the plasma membrane

Philipp Alberts et al. Mol Biol Cell. 2006 Mar.

Abstract

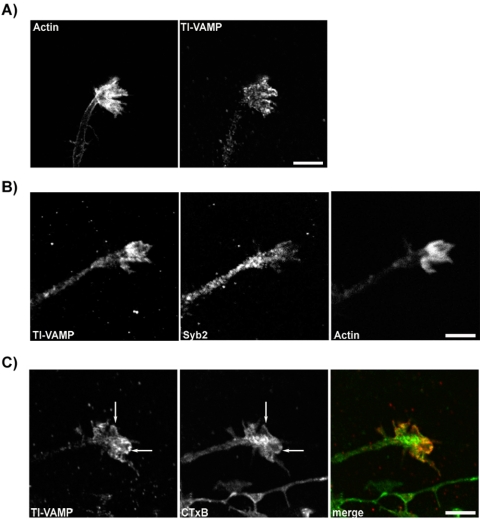
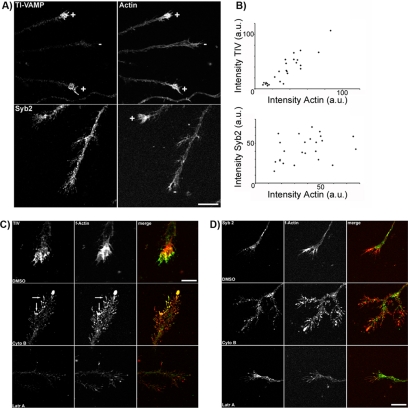
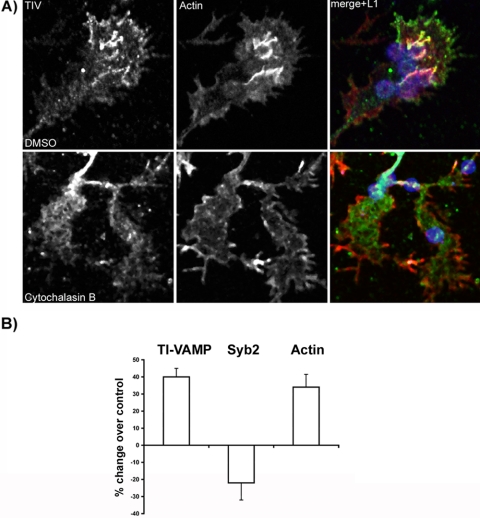
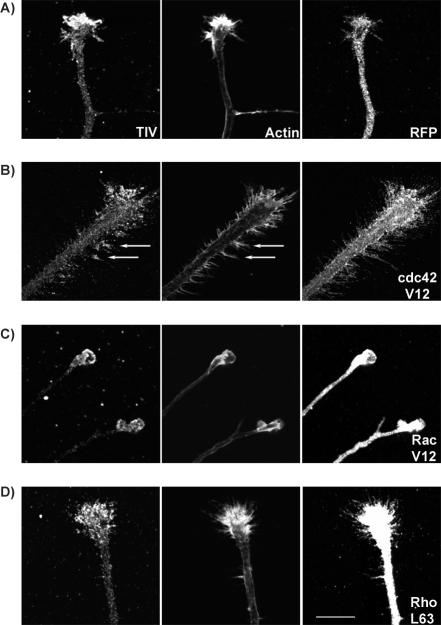
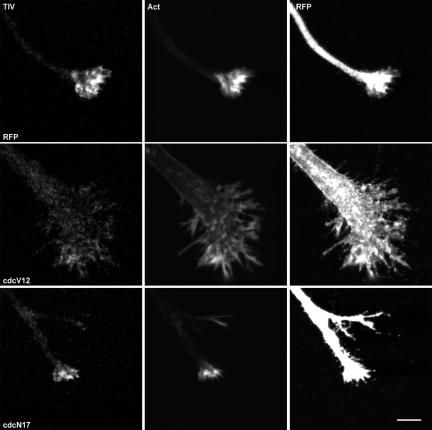
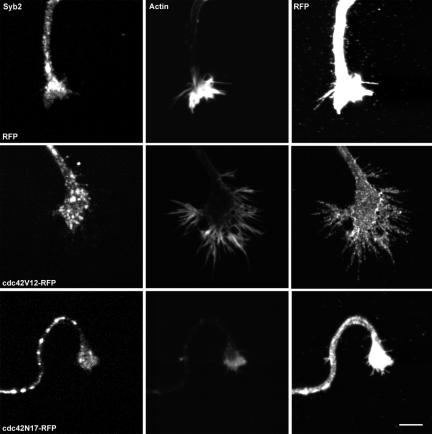
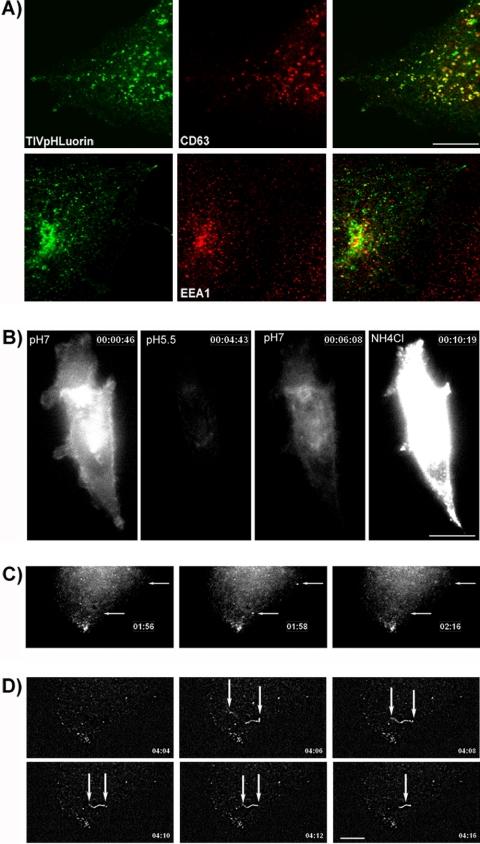
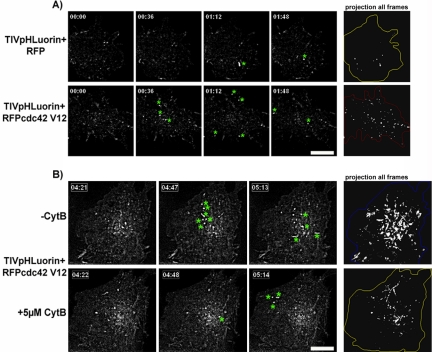
Tetanus neurotoxin-insensitive vesicle-associated membrane protein (TI-VAMP)-mediated fusion of intracellular vesicles with the plasma membrane is crucial for neurite outgrowth, a pathway not requiring synaptobrevin-dependent exocytosis. Yet, it is not known how the TI-VAMP membrane trafficking pathway is regulated or how it is coordinated with cytoskeletal dynamics within the growth cone that guide neurite outgrowth. Here, we demonstrate that TI-VAMP, but not synaptobrevin 2, concentrates in the peripheral, F-actin-rich region of the growth cones of hippocampal neurons in primary culture. Its accumulation correlates with and depends upon the presence of F-actin. Moreover, acute stimulation of actin remodeling by homophilic activation of the adhesion molecule L1 induces a site-directed, actin-dependent recruitment of the TI-VAMP compartment. Expression of a dominant-positive mutant of Cdc42, a key regulator of cell polarity, stimulates formation of F-actin- and TI-VAMP-rich filopodia outside the growth cone. Furthermore, we report that Cdc42 activates exocytosis of pHLuorin tagged TI-VAMP in an actin-dependent manner. Collectively, our data suggest that Cdc42 and regulated assembly of the F-actin network control the accumulation and exocytosis of TI-VAMP-containing membrane vesicles in growth cones to coordinate membrane trafficking and actin remodeling during neurite outgrowth.


Figures

Figure 1.
Figure 1.
Accumulation of TI-VAMP in the F-actin-rich region of axonal growth cones. (A) Cultured hippocampal neurons grown (3 days in vitro [div]) were costained for filamentous actin (left) and for TI-VAMP (right) and analyzed by confocal microscopy. Bar, 4 μm. (B) A high-magnification confocal image of an axonal growth cone triple-labeled for TI-VAMP (left), Syb2 (middle), and F-actin (right). Bar, 4 μm. (C) Living hippocampal neurons were labeled with fluorescent CTxB subunit to stain the plasma membrane (middle and green in merge). Cells were washed, fixed and costained with a mAb against TI-VAMP (left, red in merge). The TI-VAMP signal partially coincides with the plasma membrane staining by CTxB marked by arrows, yellow in merge. Bar, 4 μm.
Figure 2.
Figure 2.
TI-VAMP localization in growth cones correlates with and depends upon actin dynamics. (A) Hippocampal neurons 3 div were costained for F-actin and TI-VAMP or Syb2. Labeling intensity was analyzed by confocal microscopy. Top, high labeling intensity of TI-VAMP coincides with high labeling intensity of F-actin (+), and low labeling intensity of TI-VAMP coincides with low labeling intensity of F-actin (–). Syb2 staining does not vary with the intensity of F-actin staining (bottom). Bar, 10 μm. (B) Confocal images of hippocampal neurons stained for TI-VAMP or Syb2 were taken blind based on costaining for F-actin (24 images each). Labeling intensity of each marker in the entire growth cone was quantified and F-actin staining was plotted versus the labeling intensity of associated TI-VAMP (top) or Syb2 (bottom). Whereas TI-VAMP and F-actin labeling intensities are highly correlated (Y = –6.771 + 1.185*X; R2 = 0.818; p < 0.0001), the distribution of Syb2- and F-actin-labeling intensities seems random (Y = 31.269 + 0.312*X; R2 = 0.123; p = 0.093). (C) Hippocampal neurons (3 div) were treated for 30 min with 5 μM DMSO, 5 μM cytochalasin B (Cyto B), or 2.5 μM latrunculin A (Latr A). Cells were analyzed by confocal microscopy for expression of TI-VAMP (left) and F-actin (right). Treatment with cytochalasin B leads to a redistribution of both F-actin and TI-VAMP to highly fluorescent foci (indicated by arrows). Latrunculin A treatment disrupts the actin cytoskeleton and results in diffuse TI-VAMP staining. (D) Hippocampal neurons grown and treated as in C were analyzed by confocal microscopy for expression of Syb2 (left) and F-actin (right). The distribution of Syb2 seems unaffected by the treatments. Bars, 8 μm.
Figure 3.
Figure 3.
Actin-dependent accumulation of TI-VAMP at adhesive contacts. (A) Hippocampal neurons at 3 div were incubated with L1-coated beads in the presence of either DMSO or 5 μM cytochalasin B for 45 min. Cells were processed for confocal microscopy with TI-VAMP mAb (green), phalloidin (red), or L1 pAb (blue). Bead-shaped structures can be recognized that are positive for TI-VAMP and F-actin and that coincide with L1-coated beads present on the growth cone shown (merge) (top). Micrographs of cytochalasin B-treated cells show a number of L1-coated beads touching the extremities of the neurite (micrograph L1), but no bead-shaped structures occur that are positive for TI-VAMP or F-actin (bead diameter 4 μm). (B) Hippocampal neurons at 3 div were incubated with or without L1-coated beads and stained for TI-VAMP or synaptobrevin 2 and actin. Actin-rich regions of control growth cones or growth cones in contact with beads were selected, and associated fluorescence intensity for TI-VAMP or synaptobrevin 2 and actin was quantified. Shown is the change in intensity for the different markers induced by L1-coated beads compared with control growth cones (TIV: +40.6 ± 5%, n = 41, p = 0.0001; Syb2: –21.7 ± 10%, n = 37, p = 0.037; actin: +34 ± 7.5%, n = 78, p = 0.006).
Figure 4.
Figure 4.
Expression of Cdc42V12-RFP induces localization of actin and TI-VAMP to the axonal shaft. Cortical neurons were transfected with RFP (A) or RFP-tagged Cdc42V12 (B), Rac1V12 (C), and RhoAL63 (D) and kept in culture for 5 div at low density. Cells were fixed and stained for TI-VAMP (left), F-actin (middle), and RFP (right). Confocal images of a representative growth cone are shown for each condition. Actin and TI-VAMP do not accumulate at the leading edge of the axon when Cdc42V12 is expressed in cortical neurons. Instead, filopodial structures rich in F-actin and TI-VAMP are seen (arrows). F-actin and TI-VAMP remain in the growth cones of neurons expressing Rac1V12 or RhoAL63. Note the difference in magnification. Bar, 11 μm for A, C, and D and 18 μm for B.
Figure 5.
Figure 5.
Expression of Cdc42V12-RFP and Cdc42N17-RFP interferes with accumulation of TI-VAMP in growth cones. Cortical neurons were transfected with RFP; an RFP-tagged dominant-positive form of Cdc42, Cdc42V12-RFP; or an RFP-tagged dominant-negative form, Cdc42N17-RFP, and kept in culture for 5 d at low density. Cells were fixed and stained for TI-VAMP (left) or F-actin (middle). Confocal images for each condition of a representative growth cone are shown. RFP fluorescence is shown in the right-hand panels. Actin and TI-VAMP do not accumulate at the leading edge of the axon when Cdc42V12-RFP is expressed in cortical neurons and enrichment is reduced by expression of Cdc42N17-RFP. Note the enlarged axonal shaft and growth cone in neurons expressing Cdc42V12-RFP. Bar, 5 μm.
Figure 6.
Figure 6.
Expression of Cdc42V12-RFP and Cdc42N17-RFP does not affect Syb2 localization. Cortical neurons were transfected and processed as described for Figure 4 and stained for Syb2, F-actin, and RFP. Syb2 does not redistribute to the F-actin-rich structures induced by dominant-positive Cdc42V12-RFP but has a similar location in the central domain of growth cones under the three conditions tested. Bar, 5 μm.
Figure 7.
Figure 7.
Exocytosis of TI-VAMP-containing vesicles in Cos7 cells using TIV-pHL. (A) Cos7 cells were transfected with cDNA encoding TIV-pHL and then fixed and labeled with a polyclonal antibody to GFP (green channel) and with a mAb to CD63, a marker for late endosomes that colocalizes with endogenous TI-VAMP, to EEA1, a marker for early endosomes. Single confocal planes are shown demonstrating a high degree of colocalization between CD63 and TIVpHL (top and bottom, bar, 10 μm). (B) Live cell imaging of a Cos7 cell transfected with TIV-pHL in DMEM at pH 7.0. The medium was replaced manually with a saline solution buffered to pH 5.5, changed again with saline solution buffered to pH 7.0, and then treated with 50 mM NH4Cl in the same buffer (recordings at each condition for 2 min). The epifluorescence signal emitted dropped at pH 5.0 in a reversible manner, indicating that the signal is emitted from TIVpHL present at the cell surface, and the treatment with NH4Cl resulted in a strong increase of fluorescence because of the contribution from TIVpHL present in intracellular organelles. Bar, 15 μm. (C) Cos7 cells were transfected with TIV-pHL and prepared for live imaging. Images were taken every 2 s for 9 min. The images show two exocytic events just before exocytosis (01:56), an exocytotic event as two bright spots (1:58), and after exocytosis and endocytosis/reacidification and disappearance of the TIVpHL signal (2:16) (site of exocytosis is marked by two arrows). (D) Sequence of micrographs of the same cell recorded in A demonstrating the first appearance (4:06) and complete fusion (4:16) of a tubule with the plasma membrane. The right arrow indicates the first point of fusion with the plasma membrane (highest fluorescence intensity at time of appearance), whereas the left arrow points at the intracellular end of the tubule (C and D). Bar, 10 μm.
Figure 8.
Figure 8.
Cdc42V12 stimulates F-actin-dependent TIVpHL-mediated exocytosis. (A) Cos7 cells were transfected with TIVpHL together with RFP or Cdc42V12-RFP and analyzed for exocytosis of TIVpHL over 5 min. Stills of representative cells cotransfected with RFP (top) or Cdc42V12-RFP (bottom) are shown. Transient bright TIVpHL spots, representing exocytosis, are marked by green asterisks. Bar, 10 μm. Cumulative plots representing the total number of exocytic events during the 5-min recording time for each condition are shown on the right of each series of micrographs, the cell shapes are outlined. (B) Cos7 cells cotransfected as in A were analyzed before and 15 min after treatment with 5 μM cytochalasin B. Exocytic events occurring during the sequence shown are marked with asterisks as in A. Bar, 17 μm. Corresponding cumulative plots representing the total exocytic events that occurred during the recording time (6.26 min) in each condition are shown on the right of each panel; the shape of the cell recorded before and during CytB treatment is outlined in each case.

Similar articles

Cited by

References

    1. Alberts, P., et al. (2003). Cross talk between tetanus neurotoxin-insensitive vesicle-associated membrane protein-mediated transport and L1-mediated adhesion. Mol. Biol. Cell 14, 4207–4220. - PMC - PubMed
    1. Allen, W. E., Zicha, D., Ridley, A. J., and Jones, G. E. (1998). A role for Cdc42 in macrophage chemotaxis. J. Cell Biol. 141, 1147–1157. - PMC - PubMed
    1. Bradke, F., and Dotti, C. G. (1999). The role of local actin instability in axon formation. Science 283, 1931–1934. - PubMed
    1. Braun, V., Fraisier, V., Raposo, G., Hurbain, I., Sibarita, J. B., Chavrier, P., Galli, T., and Niedergang, F. (2004). TI-VAMP/VAMP7 is required for optimal phagocytosis of opsonised particles in macrophages. EMBO J. 23, 4166–4176. - PMC - PubMed
    1. Brown, M. D., Cornejo, B. J., Kuhn, T. B., and Bamburg, J. R. (2000). Cdc42 stimulates neurite outgrowth and formation of growth cone filopodia and lamellipodia. J. Neurobiol. 43, 352–364. - PubMed

Publication types

MeSH terms

LinkOut - more resources