

. 2006 Jan 1;34(Database issue):D637-41.
doi: 10.1093/nar/gkj006.
EMAGE: a spatial database of gene expression patterns during mouse embryo development
Affiliations
- PMID: 16381949
- PMCID: PMC1347369
- DOI: 10.1093/nar/gkj006
Item in Clipboard
EMAGE: a spatial database of gene expression patterns during mouse embryo development
Nucleic Acids Res.
.
Abstract
EMAGE (http://genex.hgu.mrc.ac.uk/Emage/database) is a freely available, curated database of gene expression patterns generated by in situ techniques in the developing mouse embryo. It is unique in that it contains standardized spatial representations of the sites of gene expression for each gene, denoted against a set of virtual reference embryo models. As such, the data can be interrogated in a novel and abstract manner by using space to define a query. Accompanying the spatial representations of gene expression patterns are text descriptions of the sites of expression, which also allows searching of the data by more conventional text-based methods.
Figures
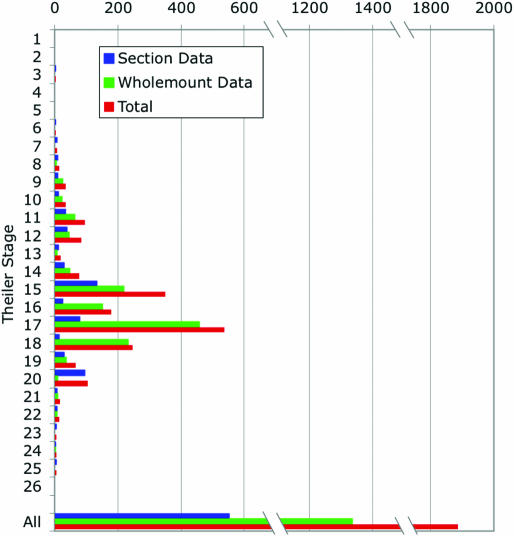
Contents of the public EMAGE database as of July 2005. The numbers of wholemount (green), section (blue) and total (red) EMAGE entries per Theiler Stage in the public EMAGE database is shown.
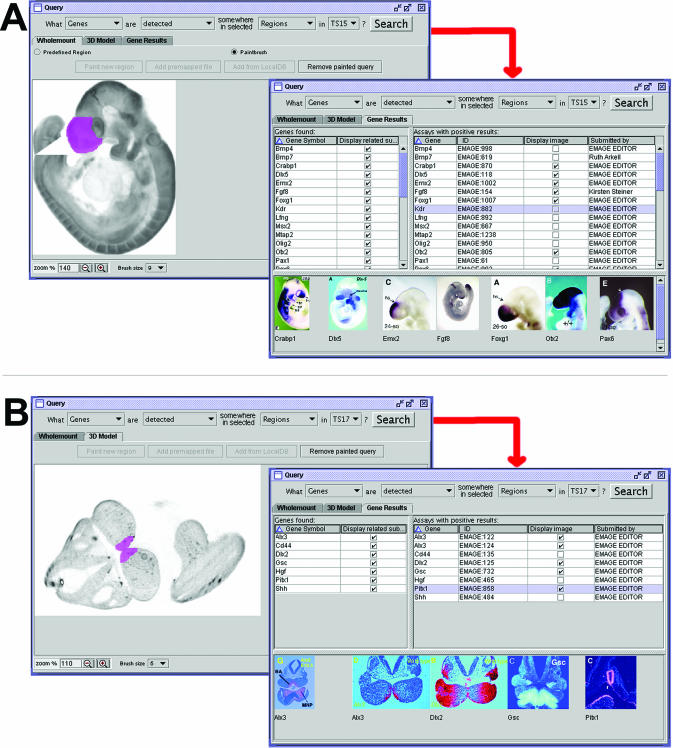
Spatial queries formulated using the EMAGE Java interface. Examples are shown of the query type ‘What genes are expressed in this region, at this stage?’ for (A) ‘wholemount’ data and (B) 3D data. Shown in the left hand panel in each case are arbitrary regions that have been defined using a simple paint tool (shown in magenta). Following searching of the central EMAGE database, a list of genes expressed somewhere in the specified region are returned, and the user can choose to display thumbnails of original data (shown in the right panels). Further details associated with an entry [such as probe, specimen, submitter information, links, further original data images (full-size) and the annotation] can be obtained by double clicking on the thumbnail image (for movies of these and other types of searches see online Supplementary Data).
References
-
- Baldock R.A., Bard J.B., Burger A., Burton N., Christiansen J., Feng G., Hill B., Houghton D., Kaufman M., Rao J., et al. EMAP and EMAGE: a framework for understanding spatially organized data. Neuroinformatics. 2003;1:309–325. - PubMed
-
- Kaufman M. The Atlas of Mouse Development. London: Academic Press; 1992.
-
- Theiler K. The House Mouse: Atlas of Embryonic Development. NY: Springer-Verlag; 1989.
Publication types
MeSH terms
Substances
Grants and funding
LinkOut - more resources
Full Text Sources
Other Literature Sources
