

How big are educational and racial fertility differentials in the U.S.?
- PMID: 16382810
- PMCID: PMC2849154
- DOI: 10.1080/19485565.2003.9989070
How big are educational and racial fertility differentials in the U.S.?
Abstract
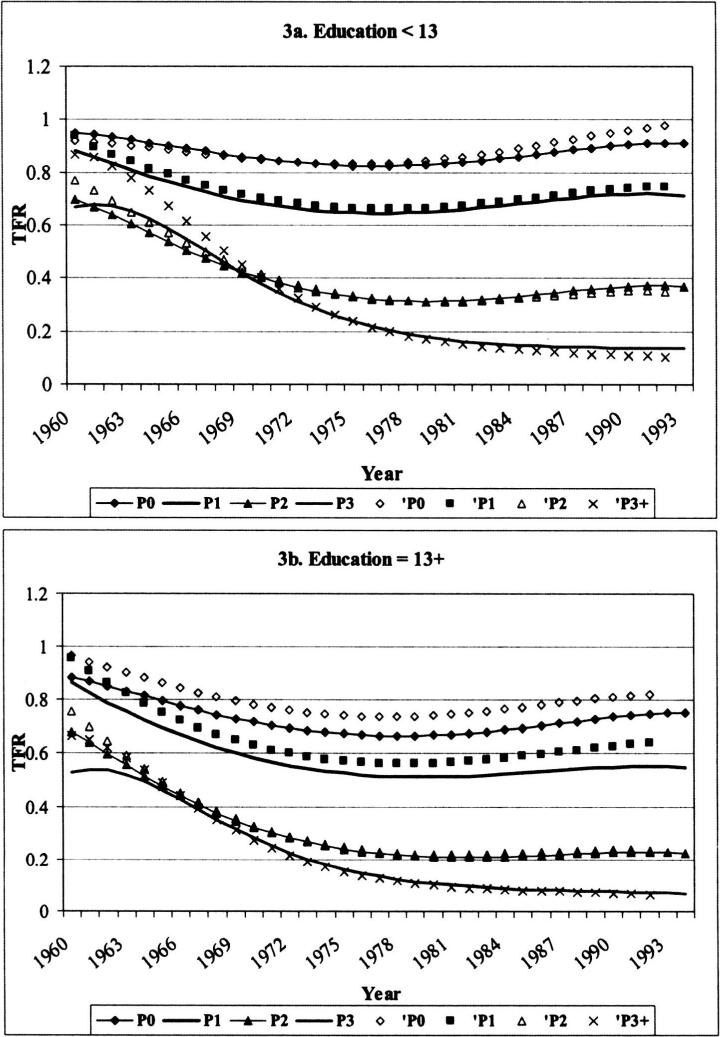
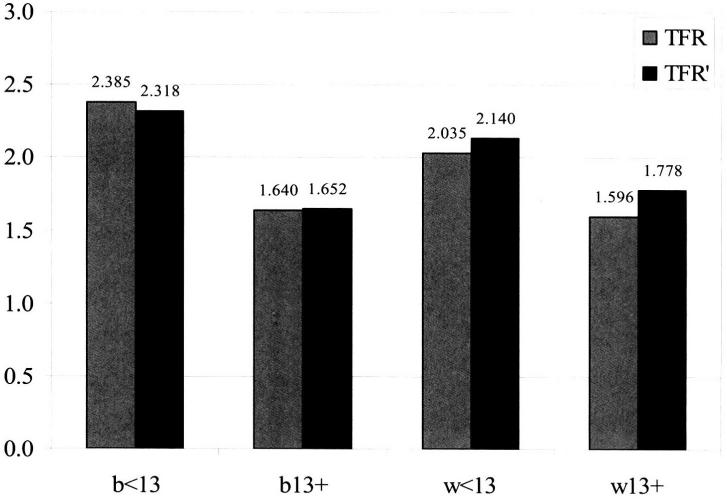
Using pooled data from the 1980, 1985, 1990 and 1995 CPS and 1988 and 1995 NSFG surveys, we show that shifts in fertility timing have occurred disproportionately for the more educated and for whites (compared to the less educated and to African Americans). Such timing shifts imply that the underlying period quantum of fertility is considerably higher for college-educated women and for whites than suggested by the standard total fertility rate. Applying the Bongaarts-Feeney model (1998), we decompose observed racial and educational differences in age-order-specific fertility rates and TFR into tempo and quantum components. We find that a modest part of educational differences and a substantial part of racial difference in period fertility can be attributed to differential changes in tempo. Analysis by race and education shows a clear interaction: higher fertility among African Americans is confined to the less educated.
Figures


Similar articles
-
Racial fertility differences: the role of female employment and education in wanted and unwanted childbearing.Soc Biol. 1996 Fall-Winter;43(3-4):218-41. doi: 10.1080/19485565.1996.9988925. Soc Biol. 1996. PMID: 9204698
-
Understanding U.S. fertility: continuity and change in the National Survey of Family Growth, 1988-1995.Fam Plann Perspect. 1996 Jan-Feb;28(1):4-12. Fam Plann Perspect. 1996. PMID: 8822409 Review.
-
2021Total Fertility Rates, by Maternal Educational Attainment and Race and Hispanic Origin: United States, 2019.Natl Vital Stat Rep. 2021 May;70(5):1-9. Natl Vital Stat Rep. 2021. PMID: 34029182
-
Women's educational attainment and fertility among Generation X in the United States.Popul Stud (Camb). 2019 Nov;73(3):335-351. doi: 10.1080/00324728.2019.1658799. Epub 2019 Oct 8. Popul Stud (Camb). 2019. PMID: 31590616
-
Fertility and family planning in the United States: insights from the National Survey of Family Growth.Fam Plann Perspect. 1988 Sep-Oct;20(5):207-17. Fam Plann Perspect. 1988. PMID: 3068068 Review.
Cited by
-
The interplay of race/ethnicity and education in fertility patterns.Popul Stud (Camb). 2022 Nov;76(3):363-385. doi: 10.1080/00324728.2022.2130965. Epub 2022 Oct 18. Popul Stud (Camb). 2022. PMID: 36256449 Free PMC article.
-
Shared Lifetimes, Multigenerational Exposure, and Educational Mobility.Demography. 2019 Jun;56(3):891-916. doi: 10.1007/s13524-019-00772-8. Demography. 2019. PMID: 31098951 Free PMC article.
-
Predicting pregnancy from pregnancy intentions: prospective findings from the Central Pennsylvania Womens's Heath Study (CePAWHS).Womens Health Issues. 2009 May-Jun;19(3):159-66. doi: 10.1016/j.whi.2009.02.001. Womens Health Issues. 2009. PMID: 19447320 Free PMC article.
-
Unpacking the "Black Box" of Race-Ethnic Variation in Fertility.Race Soc Probl. 2015 Jun 1;7(2):135-149. doi: 10.1007/s12552-014-9141-2. Race Soc Probl. 2015. PMID: 26195990 Free PMC article.
-
Education Differences in Intended and Unintended Fertility.Soc Forces. 2009 Dec;88(2):543-572. doi: 10.1353/sof.0.0278. Soc Forces. 2009. PMID: 23436948 Free PMC article.
References
-
- Bean FD, Swicegood G. Mexican American fertility patterns. University of Texas Press; Austin: 1985.
-
- Bean FD, Marcum JP. Differential fertility and the minority group status hypothesis: An assessment and review. In: Bean FD, Parker Frisbie W, editors. The Demography of Racial and Ethnic Groups. Academic Press; New York: 1978. pp. 189–211.
-
- Bean FD, Tienda M. The Hispanic population of the United States. Russell Sage; New York: 1987.
-
- Bean FD, Bell-Rose S. Immigration and opportunity: Race. ethnicity. and employment in the United States. Russell Sage Foundation; New York: 1999.
-
- Belanger A, Ouellet G. A comparative study of recent trends in Canadian and American fertility. 1980-1999. In: Belanger A, editor. Report on the Demographic Situation in Canada. Statistics Canada; Ottawa: 2002. 2001. pp. 107–136.
Publication types
MeSH terms
Grants and funding
LinkOut - more resources
Full Text Sources