. 2006 Feb;140(2):401-10.
doi: 10.1104/pp.105.070060. Epub 2005 Dec 29.

The rice mitochondrial genomes and their variations

Affiliations

The rice mitochondrial genomes and their variations

Xiangjun Tian et al. Plant Physiol. 2006 Feb.

Abstract

Based on highly redundant and high-quality sequences, we assembled rice (Oryza sativa) mitochondrial genomes for two cultivars, 93-11 (an indica variety) and PA64S (an indica-like variety with maternal origin of japonica), which are paternal and maternal strains of an elite superhybrid rice Liang-You-Pei-Jiu (LYP-9), respectively. Following up with a previous analysis on rice chloroplast genomes, we divided mitochondrial sequence variations into two basic categories, intravarietal and intersubspecific. Intravarietal polymorphisms are variations within mitochondrial genomes of an individual variety. Intersubspecific polymorphisms are variations between subspecies among their major genotypes. In this study, we identified 96 single nucleotide polymorphisms (SNPs), 25 indels, and three segmental sequence variations as intersubspecific polymorphisms. A signature sequence fragment unique to indica varieties was confirmed experimentally and found in two wild rice samples, but absent in japonica varieties. The intersubspecific polymorphism rate for mitochondrial genomes is 0.02% for SNPs and 0.006% for indels, nearly 2.5 and 3 times lower than that of their chloroplast counterparts and 21 and 38 times lower than corresponding rates of the rice nuclear genome, respectively. The intravarietal polymorphism rates among analyzed mitochondrial genomes, such as 93-11 and PA64S, are 1.26% and 1.38% for SNPs and 1.13% and 1.09% for indels, respectively. Based on the total number of SNPs between the two mitochondrial genomes, we estimate that the divergence of indica and japonica mitochondrial genomes occurred approximately 45,000 to 250,000 years ago.


Figures

Figure 1.
Figure 1.
Circular representation of the 93-11 mitochondrial genome. Circles display (from outside): (1) physical map scaled in kilobase pairs; (2) chloroplast-derived regions (green boxes) and repeats (over 5 kb; repeated copies are depicted in similar color boxes); (3) coding sequences transcribed in the clockwise direction; (4) coding sequences transcribed in the counterclockwise direction; (5) GC content variations (in a 1-kb sliding window and 100-bp increments; greater than 43.8% are in red and smaller in blue); (6) minor genotype frequencies (MF) of intravarietal indels (minor genotype over 2 at a locus; indels are marked in green and magenta lines, respectively; the gray circle represents intravarietal indels with MF = 25%; black and red dots represent indels between 93-11 and PA64S); and (7) minor genotype frequency of intravarietal SNPs (minor genotypes over 2 at a locus; brown lines depict loci with mutations occurring at the same site independent from minor genotypes; the gray circle marks intravarietal SNPs with MF = 25%; black and red dots represent transversions and transitions, respectively, when compared to PA64S).
Figure 2.
Figure 2.
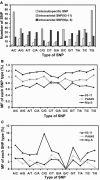
Comparisons of minor genotype frequency (MF) of intersubspecific and intravarietal SNPs in the rice mitochondrial genomes. A, Comparisons of intersubspecific and intravarietal SNPs in rice mitochondrial genomes. Intersubspecific SNPs (white bars) were the variations identified from the 93-11 to Nipponbare-S comparison. Intravarietal SNPs were those found within 93-11 (gray bars) and Nipponbare-S (black bars). The oblique line (/) separates major and minor genotypes in intravarietal SNPs and the major genotype in intersubspecific SNPs, respectively. B, MF of each SNP type in the mitochondrial genome. Data are from Table I. SNP types were arranged on the x axis. SNPs in rice varieties were indicated with different symbols: triangles for 93-11, squares for PA64S, and diamonds for Nipponbare-S. C, MF of each SNP type in the rice chloroplast genome (Tang et al., 2004).
Figure 3.
Figure 3.
Sequence alignments of intersubspecific mitochondrial variations. Sequences of SSV-500/6 (A), SSV-39/178 (B), and D-8 (C) were aligned. Sequence variations of 93-11, PA64S, and Nipponbare-S were recovered from PCR-amplified fragments. Inverted repeats are highlighted with arrowed lines.
Figure 4.
Figure 4.
Sequence analysis of the intersubspecific variations among cultivated rice and their wild ancestors. The rice varieties used in C and D are indica 2H249 (lane 1), IR64 (lane 7), SHZ (lane 9), and 93-11 (lane 10); japonica Zhonghua10 (lane 4), AZU (lane 6), LTH (lane 8), and PA64S (lane 11); an African cultivar Oryza glaberrima, as an outgroup (lane 2); and wild rice Oryza nivara (lane 3) and Oryza rufipogon (lane 5). The rice varieties used in E are indica 4A 436 (row 1), 4A 422 (row 3), II32 A (row 5), 4A 424 (row 9), and Xie A (row 11); 93-11 (row 12); and japonica 4A 434 (row 2), 4A 420 (row 4), 4A 430 (row 6), 4A PA64S (row 7), 4A 426 (row 8), and 4A 418 (row 10). A and B, Schematic maps of SSV-500/6 and SSV-39/178 on 93-11 and PA64S, respectively. Solid horizontal bars represent intersubspecific variations and genes around the variation site. Black and white arrows indicate PCR primers and the direction of gene transcription, respectively. C, PCR amplification of SSV-500/6 with primers F1 and R1. D, PCR amplification of SSV-39/178 with primers F2 and R2. E, Multiple sequence alignments of sequenced PCR products around D-8, amplified with primers F3 and R3, among different rice varieties. Capital letters I and J in parentheses depict the varieties from indica and japonica subspecies, respectively. The thirteenth and fourteenth rows are corresponding sequences of Nipponbare-S and Nipponbare-N, respectively. Dashed lines indicate nucleotide deletions; inverted repeats are underlined with arrows.

References

    1. Abdelnoor RV, Yule R, Elo A, Christensen AC, Meyer-Gauen G, Mackenzie SA (2003) Substoichiometric shifting in the plant mitochondrial genome is influenced by a gene homologous to MutS. Proc Natl Acad Sci USA 100: 5968–5973 - PMC - PubMed
    1. Cho Y, Mower JP, Qiu YL, Palmer JD (2004) Mitochondrial substitution rates are extraordinarily elevated and variable in a genus of flowering plants. Proc Natl Acad Sci USA 101: 17741–17746 - PMC - PubMed
    1. Clifton SW, Minx P, Fauron CM, Gibson M, Allen JO, Sun H, Thompson M, Barbazuk WB, Kanuganti S, Tayloe C, et al (2004) Sequence and comparative analysis of the maize NB mitochondrial genome. Plant Physiol 136: 3486–3503 - PMC - PubMed
    1. Dai ZY, Zhao BH, Liu XJ (1997) A new medium indica variety with fine quality, high yield and multi-disease resistance. Jiangsu Agricultural Science 1: 13–14
    1. Dolezal P, Smid O, Rada P, Zubacova Z, Bursac D, Sutak R, Nebesarova J, Lithgow T, Tachezy J (2005) Giardia mitosomes and trichomonad hydrogenosomes share a common mode of protein targeting. Proc Natl Acad Sci USA 102: 10924–10929 - PMC - PubMed

Publication types

Substances

Associated data

LinkOut - more resources