. 2006 Jan;188(2):619-32.
doi: 10.1128/JB.188.2.619-632.2006.

Dissection of the bacteriophage Mu strong gyrase site (SGS): significance of the SGS right arm in Mu biology and DNA gyrase mechanism

Affiliations

Dissection of the bacteriophage Mu strong gyrase site (SGS): significance of the SGS right arm in Mu biology and DNA gyrase mechanism

Mark Oram et al. J Bacteriol. 2006 Jan.

Abstract

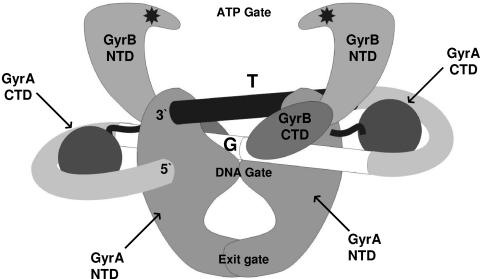
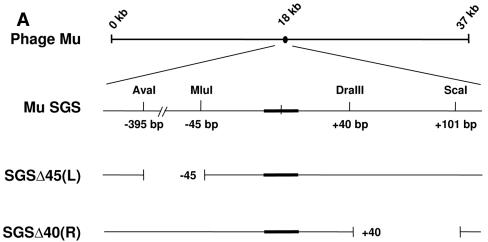
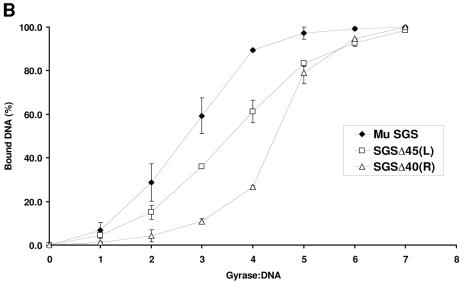
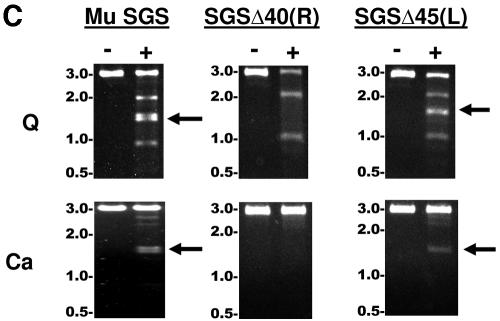
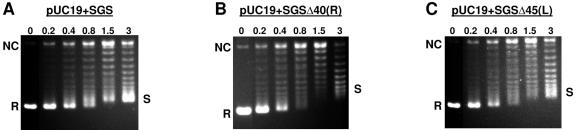
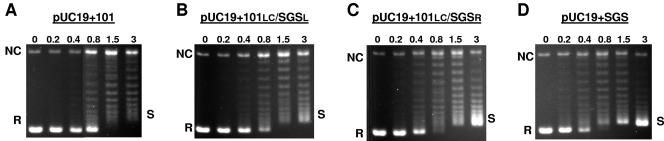
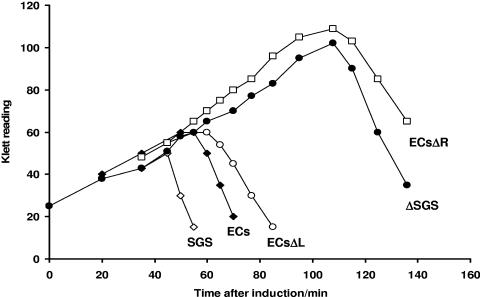
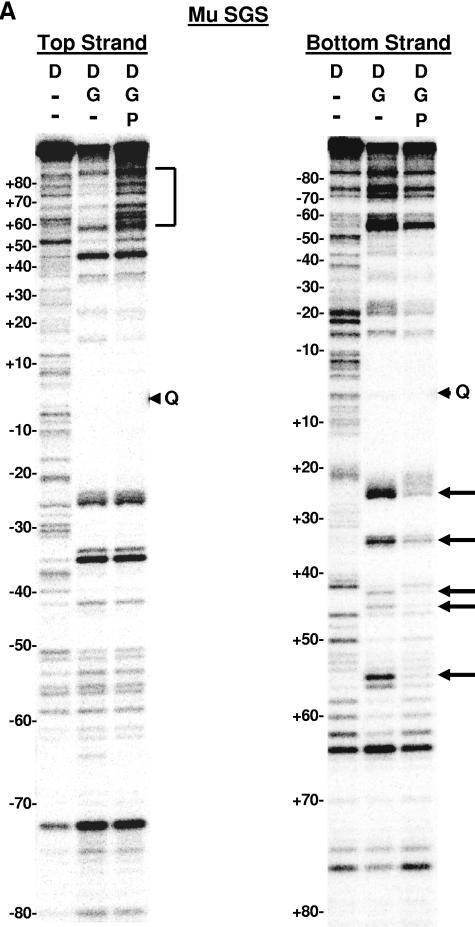
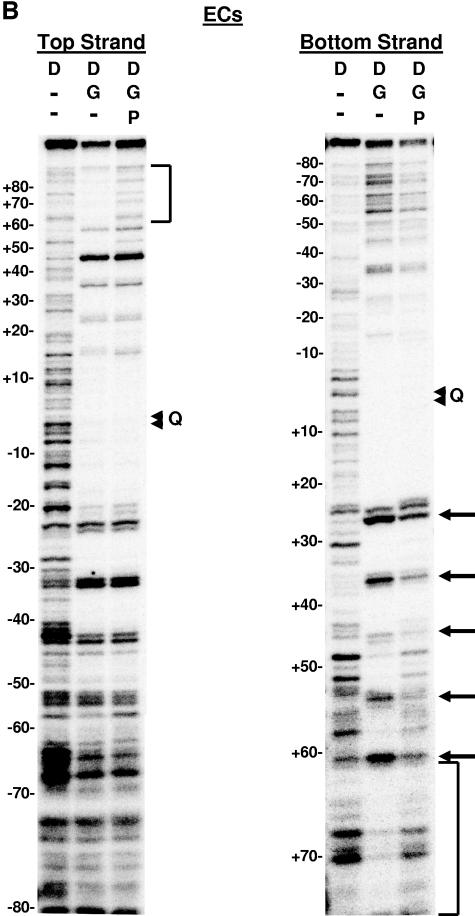
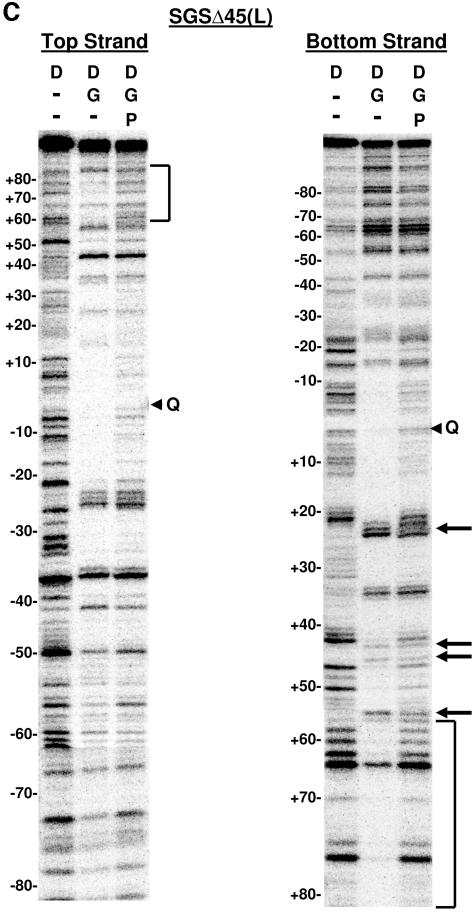
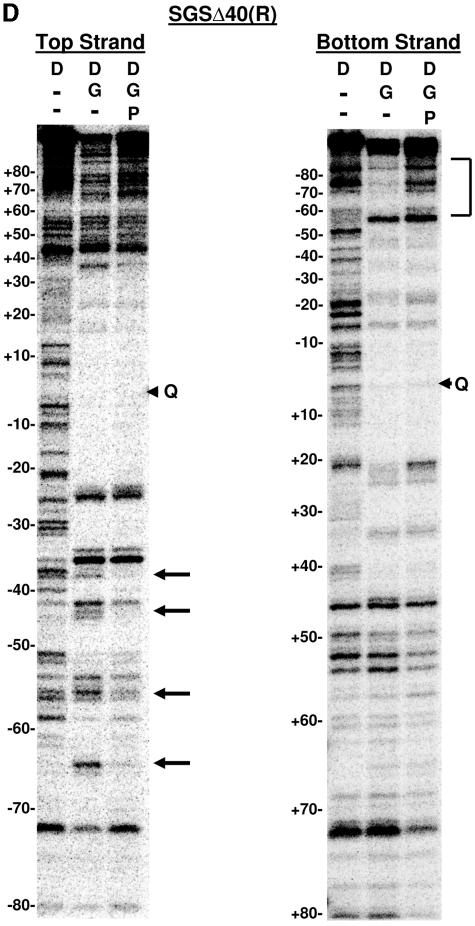
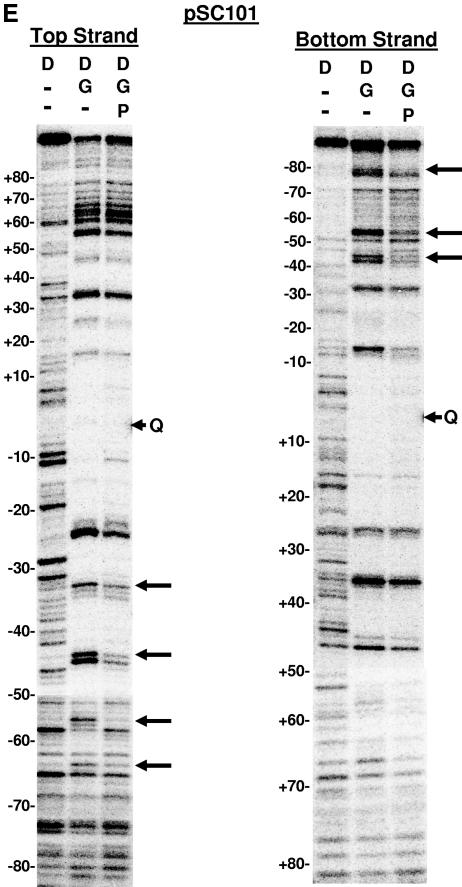
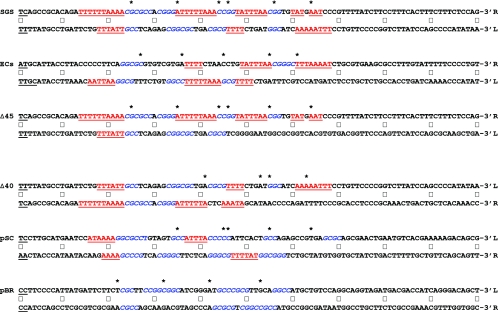
The bacteriophage Mu strong gyrase site (SGS), required for efficient phage DNA replication, differs from other gyrase sites in the efficiency of gyrase binding coupled with a highly processive supercoiling activity. Genetic studies have implicated the right arm of the SGS as a key structural feature for promoting rapid Mu replication. Here, we show that deletion of the distal portion of the right arm abolishes efficient binding, cleavage, and supercoiling by DNA gyrase in vitro. DNase I footprinting analysis of the intact SGS revealed an adenylyl imidodiphosphate-dependent change in protection in the right arm, indicating that this arm likely forms the T segment that is passed through the cleaved G segment during the supercoiling reaction. Furthermore, in an SGS derivative with an altered right-arm sequence, the left arm showed these changes, suggesting that the selection of a T segment by gyrase is determined primarily by the sequences of the arms. Analysis of the sequences of the SGS and other gyrase sites suggests that the choice of T segment correlates with which arm possesses the more extensive set of phased anisotropic bending signals, with the Mu right arm possessing an unusually extended set of such signals. The implications of these observations for the structure of the gyrase-DNA complex and for the biological function of the Mu SGS are discussed.


Figures

FIG. 1.
FIG. 1.
A structural model for the gyrase-DNA complex. The DNA gyrase A and B subunits (GyrA and GyrB) are each composed of an NTD and a CTD. The GyrB NTDs carry the ATP binding sites, starred in the figure, and also define an ATP gate, shown here in the open configuration. The GyrA NTD also forms two protein bridges, the DNA gate and the exit gate, which are here shown closed. The GyrA CTDs are likely linked to the rest of the A subunits by a flexible linker. The possible path of the DNA associated with the enzyme is indicated, with arbitrary 5′ and 3′ designations to delineate the binding site. The continuation of the DNA substrate is not indicated. The core of the DNA site, or G segment, is given as a split white cylinder, the split being the point of 4-bp staggered cleavage. The T segment is shown by the black cylinder, positioned just above the G segment. The mechanistic effects of ATP binding on this structure are expanded upon in the text.
FIG. 2.
FIG. 2.
Binding and cleavage by gyrase of Mu SGS and deletion derivatives. (A) The relative position of the SGS in the 37-kb Mu genome is shown by the black oval. An expanded region below shows the core of the SGS as a thickened black line, and the sequence is numbered centered on the point of cleavage, as shown by the small vertical line at the core center. To make the derivative SGS sequences, cuts were made at the naturally occurring restriction sites indicated, the ends blunted where necessary, and the sites were reassembled by blunt-end ligation. (B) DNA fragments 200 bp in length (2.5 nM), with the SGS core falling centrally in each molecule, were incubated with increasing amounts of DNA gyrase at 37°C for 30 min. Bound and unbound molecules were then separated on 5% polyacrylamide gels, and the relative amounts were quantified. Binding curves were plotted as shown, with data points and error bars representing the means ± range of two experiments. (C) Linear recombinant pUC19 plasmids (10 nM), carrying the sites indicated above each gel, were incubated either without (−) or with (+) 40 nM gyrase in the presence of enoxacin (Q) (top) or with Ca2+ (Ca) replacing Mg2+ in the reaction buffer (bottom). After 30 min at 37°C, cleavage was induced by the addition of sodium dodecyl sulfate, followed by proteinase K. Products were resolved on a 1% agarose gel, with sizes of DNA markers (in kilobases) indicated to the left of the gels. The bands at 2 kb and 1 kb produced by enoxacin-dependent DNA cleavage arise from cutting at the pUC19 gyrase site lying just upstream of the bla gene promoter, and the doublet at 1.5 kb, shown by arrows where visible, arises from cleavage at the cloned gyrase sites.
FIG. 2.
FIG. 2.
Binding and cleavage by gyrase of Mu SGS and deletion derivatives. (A) The relative position of the SGS in the 37-kb Mu genome is shown by the black oval. An expanded region below shows the core of the SGS as a thickened black line, and the sequence is numbered centered on the point of cleavage, as shown by the small vertical line at the core center. To make the derivative SGS sequences, cuts were made at the naturally occurring restriction sites indicated, the ends blunted where necessary, and the sites were reassembled by blunt-end ligation. (B) DNA fragments 200 bp in length (2.5 nM), with the SGS core falling centrally in each molecule, were incubated with increasing amounts of DNA gyrase at 37°C for 30 min. Bound and unbound molecules were then separated on 5% polyacrylamide gels, and the relative amounts were quantified. Binding curves were plotted as shown, with data points and error bars representing the means ± range of two experiments. (C) Linear recombinant pUC19 plasmids (10 nM), carrying the sites indicated above each gel, were incubated either without (−) or with (+) 40 nM gyrase in the presence of enoxacin (Q) (top) or with Ca2+ (Ca) replacing Mg2+ in the reaction buffer (bottom). After 30 min at 37°C, cleavage was induced by the addition of sodium dodecyl sulfate, followed by proteinase K. Products were resolved on a 1% agarose gel, with sizes of DNA markers (in kilobases) indicated to the left of the gels. The bands at 2 kb and 1 kb produced by enoxacin-dependent DNA cleavage arise from cutting at the pUC19 gyrase site lying just upstream of the bla gene promoter, and the doublet at 1.5 kb, shown by arrows where visible, arises from cleavage at the cloned gyrase sites.
FIG. 3.
FIG. 3.
Supercoiling of pUC19 plasmids bearing SGS-based gyrase sites. Relaxed pUC19 constructs (10 nM) were incubated at 37°C for 30 min with increasing concentrations of DNA gyrase, with the enzyme concentration (in nanometers) shown above each lane. Samples were resolved on 1% agarose gels with 40-μg/ml chloroquine. R, relaxed substrate; NC, nicked circular DNA; S, negatively supercoiled product.
FIG. 4.
FIG. 4.
Supercoiling of pUC19 plasmids bearing hybrid gyrase sites. Relaxed pUC19 constructs (10 nM) were incubated at 37°C for 30 min with increasing concentrations of DNA gyrase, with the enzyme concentration (in nanometers) shown above each lane. Samples were resolved on 1% agarose gels containing 40-μg/ml chloroquine. R, relaxed substrate; NC, nicked circular DNA; S, negatively supercoiled product.
FIG. 5.
FIG. 5.
Host lysis by chimeric Mu prophage bearing ECs-based sites. The central region of the Mu genome carrying the SGS was replaced by either the wild-type ECs site or a derivative with substituted sequence in the left (ECsΔL) or right (ECsΔR) arms. Host E. coli cells carrying one of these prophages were grown at 30°C, and Mu replication was induced by a temperature shift to 42°C. Wild-type Mu prophage (SGS) or one lacking the entire SGS (ΔSGS) was included as a control. Host lysis was followed by Klett readings of the induced cultures.
FIG. 6.
FIG. 6.
DNase I footprinting on natural and SGS-based gyrase sites. Each site was obtained in the form of a 200-bp linear molecule, radiolabeled at the 5′ end of either the top or bottom strands. Each panel shows the result of a footprinting experiment performed on one of the substrates, as indicated above the gels. The DNA was incubated either alone (D) or in two reactions with DNA gyrase (G) at 37°C for 15 min to allow formation of bound complexes. ADPNP (P) was then added to one enzyme-containing reaction mixture, and all three samples were incubated an additional 5 min. DNase I was then added, and the reactions were quenched after 2 min. DNA samples were purified and separated on 6% denaturing polyacrylamide gels. Arrowheads marked with a Q on the right of each gel show the location of enoxacin-dependent cleavage of each fragment, and the numbers on the left of each panel show the positions of every 10th nucleotide from the center of the gyrase cleavage site, numbered, following the convention used throughout this paper. Vertical brackets highlight regions of additional protection to the DNA arms in the absence of ADPNP that were lost on the addition of nucleotide. Arrows on the right of the gels highlight positions exhibiting increased sensitivity to DNase I in the absence of ADPNP. (A) Mu SGS; (B) ECs; (C) SGSΔ45(L); (D) SGSΔ40(R); (E) pSC101.
FIG. 6.
FIG. 6.
DNase I footprinting on natural and SGS-based gyrase sites. Each site was obtained in the form of a 200-bp linear molecule, radiolabeled at the 5′ end of either the top or bottom strands. Each panel shows the result of a footprinting experiment performed on one of the substrates, as indicated above the gels. The DNA was incubated either alone (D) or in two reactions with DNA gyrase (G) at 37°C for 15 min to allow formation of bound complexes. ADPNP (P) was then added to one enzyme-containing reaction mixture, and all three samples were incubated an additional 5 min. DNase I was then added, and the reactions were quenched after 2 min. DNA samples were purified and separated on 6% denaturing polyacrylamide gels. Arrowheads marked with a Q on the right of each gel show the location of enoxacin-dependent cleavage of each fragment, and the numbers on the left of each panel show the positions of every 10th nucleotide from the center of the gyrase cleavage site, numbered, following the convention used throughout this paper. Vertical brackets highlight regions of additional protection to the DNA arms in the absence of ADPNP that were lost on the addition of nucleotide. Arrows on the right of the gels highlight positions exhibiting increased sensitivity to DNase I in the absence of ADPNP. (A) Mu SGS; (B) ECs; (C) SGSΔ45(L); (D) SGSΔ40(R); (E) pSC101.
FIG. 7.
FIG. 7.
Anisotropic flexibility of gyrase sites. The nucleotide sequences of the 200-bp sites are given in full. To facilitate comparison of each arm of the sites directly, the sequence of one of the arms was folded back, an arrangement that places the central 4-bp cleavage site, shown in underlined boldface black type, at the left of the figure. (The ECs cleavage site comprises two overlapping sites, GCAA and AAAT; hence, a total of 6 bp are underlined.) Central dots mark every 10th nucleotide from the cleavage site. The upper line of the each site gives the sequence that runs 5′ to 3′ downstream from the cleavage site, whereas the lower, folded-back sequence is that complementary to the arm upstream from the cleavage site, ensuring that each line of the sequence runs in the conventional 5′-to-3′ direction. A label (L or R) indicates the left or right arm of each site, based on the scheme used throughout this work. Asterisks above the sequences mark the positions of DNase I-hypersensitive sites observed in the absence of ADPNP. GC-rich regions of ≥3 bp in phase with the marked DNase I cleavage sites are shown in blue italics; conversely, AT regions of ≥3 bp in length that are out of phase are in underlined red type. Colorings were done without prejudice, so that the entire length of an A-T or G-C run was included. (In some cases, particularly in the SGS and ECs right arms, some AT runs are so long that these are both in phase and out of phase.) Finally, each sequence is presented such that the presumptive T segments implied by DNase I footprinting are in the upper line and the non-T segments are in the lower line.

References

    1. Berger, J. M., S. J. Gamblin, S. C. Harrison, and J. C. Wang. 1996. Structure and mechanism of DNA topoisomerase II. Nature 379:225-232. - PubMed
    1. Champoux, J. J. 2001. DNA topoisomerases: structure, function, and mechanism. Annu. Rev. Biochem. 70:369-413. - PubMed
    1. Corbett, K. D., R. K. Shultzaberger, and J. M. Berger. 2004. The C-terminal domain of DNA gyrase A adopts a DNA-bending beta-pinwheel fold. Proc. Natl. Acad. Sci. USA 101:7293-7298. - PMC - PubMed
    1. Costenaro, L., J. G. Grossmann, C. Ebel, and A. Maxwell. 2005. Small-angle X-ray scattering reveals the solution structure of the full-length DNA gyrase a subunit. Structure (Cambridge) 13:287-296. - PubMed
    1. Craigie, R., and K. Mizuuchi. 1986. Role of DNA topology in Mu transposition: mechanism of sensing the relative orientation of two DNA segments. Cell 45:793-800. - PubMed

Publication types