

Transcriptional studies and regulatory interactions between the phoR-phoP operon and the phoU, mtpA, and ppk genes of Streptomyces lividans TK24
- PMID: 16385057
- PMCID: PMC1347273
- DOI: 10.1128/JB.188.2.677-686.2006
Transcriptional studies and regulatory interactions between the phoR-phoP operon and the phoU, mtpA, and ppk genes of Streptomyces lividans TK24
Abstract
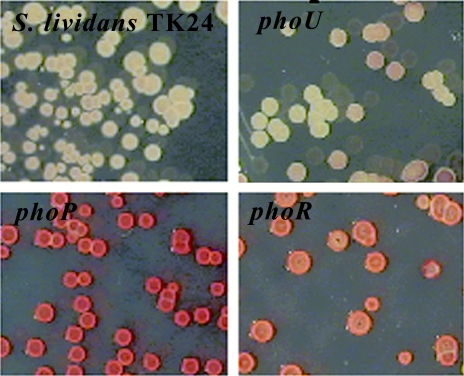
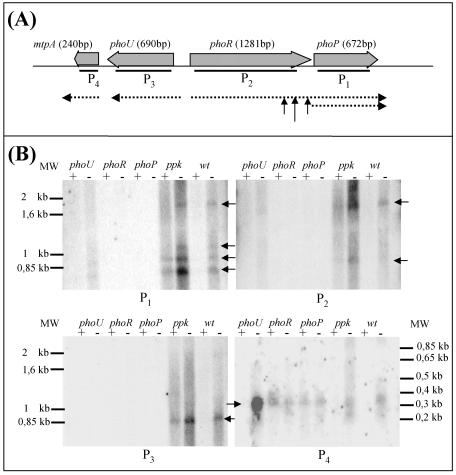
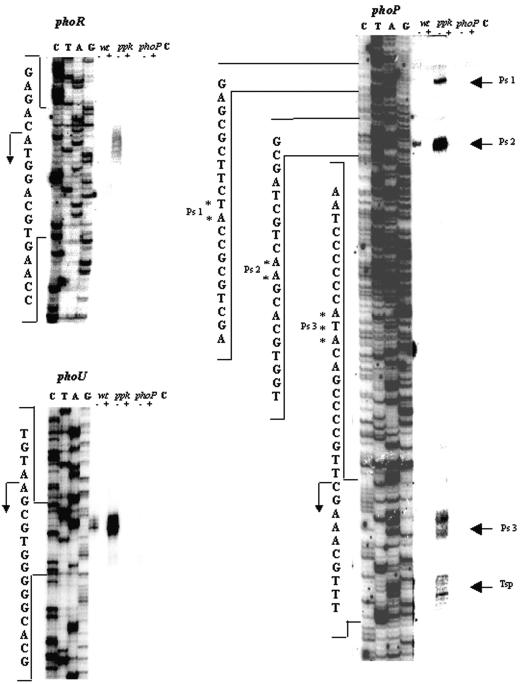
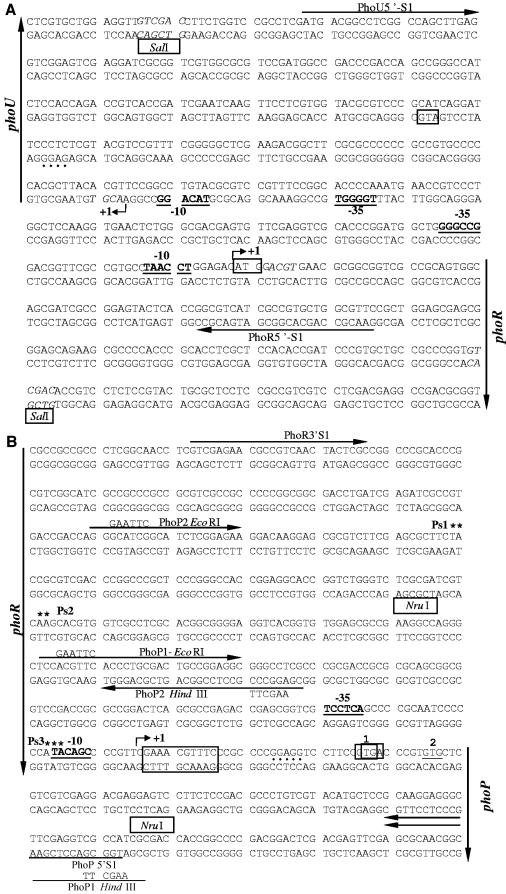
The PhoR/PhoP two-component system of Streptomyces lividans was previously shown to allow the growth of the bacteria at low Pi concentrations and to negatively control antibiotic production. The present study focuses on the transcriptional analysis of phoR and phoP, along with the phoU and mtpA genes that are transcribed divergently from the phoRP operon in S. lividans. The effect of phoR, phoP, phoU, and ppk mutations on transcription of these genes was examined under phosphate-replete and phosphate-limited conditions. We demonstrated that phoR and phoP were cotranscribed as a leaderless bicistronic transcript cleaved at discrete sites toward the 3' end of phoR. In addition, phoP could also be transcribed alone from a promoter located at the 3' end of phoR. The phoU and mtpA genes, predicted to encode metal binding proteins, were shown to be transcribed as monocistronic transcripts. The expression of phoR-phoP, phoP, and phoU was found to be induced under conditions of Pi limitation in S. lividans TK24. This induction, requiring both PhoR and PhoP, was significantly weaker in the phoU mutant but much stronger in the ppk mutant than in the parental strain. The expression of mtpA was also shown to be up-regulated when Pi was limiting but independently of PhoR/PhoP. The induction of mtpA expression was much stronger in the phoU mutant strain than in the other strains. This study revealed interesting regulatory interactions between the different genes and allowed us to propose putative roles for PhoU and MtpA in the adaptation to phosphate scarcity.
Figures
Similar articles
-
Transcriptional and preliminary functional analysis of the six genes located in divergence of phoR/phoP in Streptomyces lividans.Appl Microbiol Biotechnol. 2012 Sep;95(6):1553-66. doi: 10.1007/s00253-012-3995-2. Epub 2012 Apr 1. Appl Microbiol Biotechnol. 2012. PMID: 22466952
-
Regulation of ppk expression and in vivo function of Ppk in Streptomyces lividans TK24.J Bacteriol. 2006 Sep;188(17):6269-76. doi: 10.1128/JB.00202-06. J Bacteriol. 2006. PMID: 16923894 Free PMC article.
-
The two-component PhoR-PhoP system controls both primary metabolism and secondary metabolite biosynthesis in Streptomyces lividans.Proc Natl Acad Sci U S A. 2003 May 13;100(10):6133-8. doi: 10.1073/pnas.0931429100. Epub 2003 May 2. Proc Natl Acad Sci U S A. 2003. PMID: 12730372 Free PMC article.
-
Transcriptomic studies of phosphate control of primary and secondary metabolism in Streptomyces coelicolor.Appl Microbiol Biotechnol. 2012 Jul;95(1):61-75. doi: 10.1007/s00253-012-4129-6. Epub 2012 May 24. Appl Microbiol Biotechnol. 2012. PMID: 22622839 Review.
-
Gene regulation by phosphate in enteric bacteria.J Cell Biochem. 1993 Jan;51(1):47-54. doi: 10.1002/jcb.240510110. J Cell Biochem. 1993. PMID: 8432742 Review.
Cited by
-
Structural and functional characterization of mycobacterial PhoH2 and identification of potential inhibitor of its enzymatic activity.Braz J Microbiol. 2024 Jun;55(2):1033-1051. doi: 10.1007/s42770-024-01267-4. Epub 2024 Feb 22. Braz J Microbiol. 2024. PMID: 38386260 Free PMC article.
-
Repression of antibiotic production and sporulation in Streptomyces coelicolor by overexpression of a TetR family transcriptional regulator.Appl Environ Microbiol. 2010 Dec;76(23):7741-53. doi: 10.1128/AEM.00819-10. Epub 2010 Oct 8. Appl Environ Microbiol. 2010. PMID: 20935121 Free PMC article.
-
Role of polyphosphates in microbial adaptation to extreme environments.Appl Environ Microbiol. 2008 Oct;74(19):5867-74. doi: 10.1128/AEM.00501-08. Epub 2008 Aug 15. Appl Environ Microbiol. 2008. PMID: 18708516 Free PMC article. Review. No abstract available.
-
Self-control of the PHO regulon: the PhoP-dependent protein PhoU controls negatively expression of genes of PHO regulon in Streptomyces coelicolor.J Antibiot (Tokyo). 2017 Nov 1. doi: 10.1038/ja.2017.130. Online ahead of print. J Antibiot (Tokyo). 2017. PMID: 29089595
-
Expression of genes of the Pho regulon is altered in Streptomyces coelicolor.Sci Rep. 2020 May 22;10(1):8492. doi: 10.1038/s41598-020-65087-w. Sci Rep. 2020. PMID: 32444655 Free PMC article.
References
-
- Andrews, G. K. 2000. Regulation of metallothionein gene expression by oxidative stress and metal ions. Biochem. Pharmacol. 59:95-104. - PubMed
-
- Avignone Rossa, C., J. White, A. Kuiper, P. W. Postma, M. Bibb, and M. J. Teixeira de Mattos. 2002. Carbon flux distribution in antibiotic-producing chemostat cultures of Streptomyces lividans. Metab. Eng. 4:138-150. - PubMed
-
- Beard, S. J., R. Hashim, G. Wu, M. R. Binet, M. N. Hughes, and R. K. Poole. 2000. Evidence for the transport of zinc(II) ions via the pit inorganic phosphate transport system in Escherichia coli. FEMS Microbiol. Lett. 184:231-235. - PubMed
-
- Blanco, A. G., M. Sola, F. X. Gomis-Ruth, and M. Coll. 2002. Tandem DNA recognition by PhoB, a two-component signal transduction transcriptional activator. Structure (Cambridge) 10:701-713. - PubMed
Publication types
MeSH terms
Substances
LinkOut - more resources
Full Text Sources
Research Materials
Miscellaneous
