Automated detection of elementary calcium release events using the á trous wavelet transform
- PMID: 16387777
- PMCID: PMC1386793
- DOI: 10.1529/biophysj.105.069930
Automated detection of elementary calcium release events using the á trous wavelet transform
Abstract
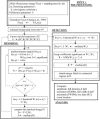
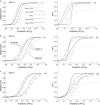
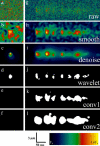
We developed an algorithm for the automated detection and analysis of elementary Ca2+ release events (ECRE) based on the two-dimensional nondecimated wavelet transform. The transform is computed with the "à trous" algorithm using the cubic B-spline as the basis function and yields a multiresolution analysis of the image. This transform allows for highly efficient noise reduction while preserving signal amplitudes. ECRE detection is performed at the wavelet levels, thus using the whole spectral information contained in the image. The algorithm was tested on synthetic data at different noise levels as well as on experimental data of ECRE. The noise dependence of the statistical properties of the algorithm (detection sensitivity and reliability) was determined from synthetic data and detection parameters were selected to optimize the detection of experimental ECRE. The wavelet-based method shows considerably higher detection sensitivity and less false-positive counts than previously employed methods. It allows a more efficient detection of elementary Ca2+ release events than conventional methods, in particular in the presence of elevated background noise levels. The subsequent analysis of the morphological parameters of ECRE is reliably reproduced by the analysis procedure that is applied to the median filtered raw data. Testing the algorithm more rigorously showed that event parameter histograms (amplitude, rise time, full duration at half-maximum, and full width at half-maximum) were faithfully extracted from synthetic, "in-focus" and "out-of-focus" line scan sparks. Most importantly, ECRE obtained with laser scanning confocal microscopy of chemically skinned mammalian skeletal muscle fibers could be analyzed automatically to reproducibly establish event parameter histograms. In summary, our method provides a new valuable tool for highly reliable automated detection of ECRE in muscle but can also be adapted to other preparations.
Figures


Similar articles
-
Fast XYT imaging of elementary calcium release events in muscle with multifocal multiphoton microscopy and wavelet denoising and detection.IEEE Trans Med Imaging. 2007 Jul;26(7):925-34. doi: 10.1109/TMI.2007.895471. IEEE Trans Med Imaging. 2007. PMID: 17649906
-
Improved spark and ember detection using stationary wavelet transforms.J Theor Biol. 2010 Jun 21;264(4):1279-92. doi: 10.1016/j.jtbi.2010.04.005. Epub 2010 Apr 9. J Theor Biol. 2010. PMID: 20382167
-
Improved peak detection in mass spectrum by incorporating continuous wavelet transform-based pattern matching.Bioinformatics. 2006 Sep 1;22(17):2059-65. doi: 10.1093/bioinformatics/btl355. Epub 2006 Jul 4. Bioinformatics. 2006. PMID: 16820428
-
Model-based analysis of elementary Ca(2+) release events in skinned mammalian skeletal muscle fibres.Eur Biophys J. 2002 Sep;31(5):331-40. doi: 10.1007/s00249-002-0223-5. Epub 2002 Jun 11. Eur Biophys J. 2002. PMID: 12202909
-
A fast multilevel algorithm for wavelet-regularized image restoration.IEEE Trans Image Process. 2009 Mar;18(3):509-23. doi: 10.1109/TIP.2008.2008073. Epub 2009 Feb 2. IEEE Trans Image Process. 2009. PMID: 19188124
Cited by
-
PunctaSpecks: A tool for automated detection, tracking, and analysis of multiple types of fluorescently labeled biomolecules.Cell Calcium. 2020 Jul;89:102224. doi: 10.1016/j.ceca.2020.102224. Epub 2020 May 25. Cell Calcium. 2020. PMID: 32502904 Free PMC article.
-
Algorithm for biological second messenger analysis with dynamic regions of interest.PLoS One. 2023 May 11;18(5):e0284394. doi: 10.1371/journal.pone.0284394. eCollection 2023. PLoS One. 2023. PMID: 37167308 Free PMC article.
-
Speckle reduction in optical coherence tomography images using digital filtering.J Opt Soc Am A Opt Image Sci Vis. 2007 Jul;24(7):1901-10. doi: 10.1364/josaa.24.001901. J Opt Soc Am A Opt Image Sci Vis. 2007. PMID: 17728812 Free PMC article.
-
Activation of muscarinic receptors increases the activity of the granule neurones of the rat dorsal cochlear nucleus--a calcium imaging study.Pflugers Arch. 2012 Jun;463(6):829-44. doi: 10.1007/s00424-012-1103-1. Epub 2012 May 1. Pflugers Arch. 2012. PMID: 22547003
-
Multidimensional detection and analysis of Ca2+ sparks in cardiac myocytes.Biophys J. 2007 Jun 15;92(12):4433-43. doi: 10.1529/biophysj.106.089359. Epub 2007 Mar 16. Biophys J. 2007. PMID: 17369419 Free PMC article.
References
-
- Cheng, H., W. J. Lederer, and M. B. Cannell. 1993. Calcium sparks: elementary events underlying excitation-contraction coupling in heart muscle. Science. 262:740–744. - PubMed
-
- Tsugorka, A., E. Ríos, and L. Blatter. 1995. Imaging elementary events of calcium release in skeletal muscle cells. Science. 269:1723–1726. - PubMed
-
- Klein, M. G., H. Cheng, L. F. Santana, Y. H. Jiang, W. J. Lederer, and M. F. Schneider. 1996. Two mechanisms of quantized calcium release in skeletal muscle. Nature. 379:455–458. - PubMed
-
- Nelson, M. T., H. Cheng, M. Rubart, L. F. Santana, A. D. Bonev, H. J. Knot, and W. J. Lederer. 1995. Relaxation of arterial smooth muscle by calcium sparks. Science. 270:633–637. - PubMed
-
- Wang, X., N. Weisleder, C. Collet, J. Zhou, Y. Chu, Y. Hirata, X. Zhao, Z. Pan, M. Brotto, H. Cheng, and J. Ma. 2005. Uncontrolled calcium sparks act as a dystrophic signal for mammalian skeletal muscle. Nat. Cell Biol. 7:525–530. - PubMed
Publication types
MeSH terms
Substances
LinkOut - more resources
Full Text Sources
Miscellaneous

