

Characterization of the liquid-ordered state by proton MAS NMR
- PMID: 16387785
- PMCID: PMC1386783
- DOI: 10.1529/biophysj.105.070441
Characterization of the liquid-ordered state by proton MAS NMR
Abstract
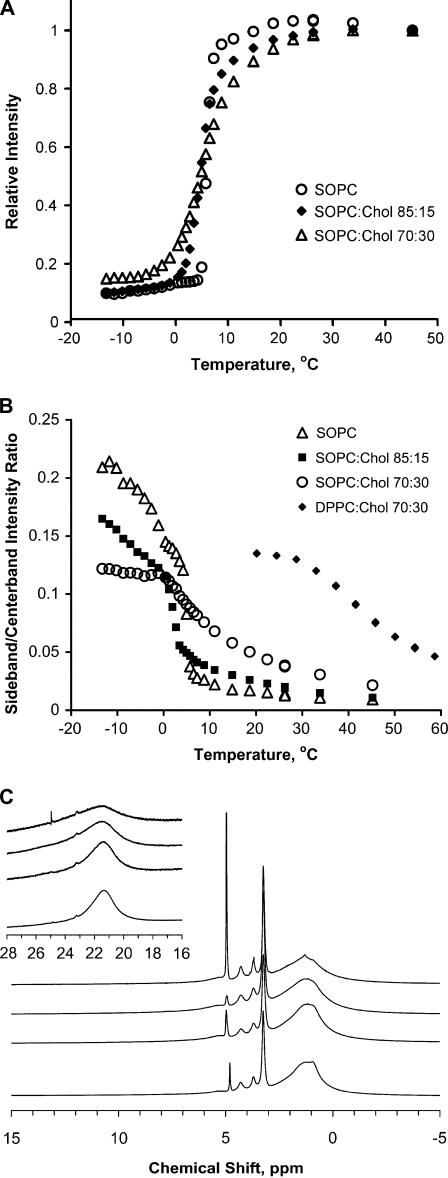
We investigated if magic angle spinning (MAS) 1H NMR can be used as a tool for detection of liquid-ordered domains (rafts) in membranes. In experiments with the lipids SOPC, DOPC, DPPC, and cholesterol we demonstrated that 1H MAS NMR spectra of liquid-ordered domains (lo) are distinctly different from liquid-disordered (ld) and solid-ordered (so) membrane regions. At a MAS frequency of 10 kHz the methylene proton resonance of hydrocarbon chains in the ld phase has a linewidth of 50 Hz. The corresponding linewidth is 1 kHz for the lo phase and several kHz for the so phase. According to results of 1H NMR dipolar echo spectroscopy, the broadening of MAS resonances in the lo phase results from an increase in effective strength of intramolecular proton dipolar interactions between adjacent methylene groups, most likely because of a lower probability of gauche/trans isomerization in lo. In spectra recorded as a function of temperature, the onset of lo domain (raft) formation is seen as a sudden onset of line broadening. Formation of small domains yielded homogenously broadened resonance lines, whereas large lo domains (diameter >0.3 microm) in an ld environment resulted in superposition of the narrow resonances of the ld phase and the much broader resonances of lo. 1H MAS NMR may be applied to detection of rafts in cell membranes.
Figures


Similar articles
-
Diffusion of cholesterol and its precursors in lipid membranes studied by 1H pulsed field gradient magic angle spinning NMR.Biophys J. 2005 Oct;89(4):2504-12. doi: 10.1529/biophysj.105.062018. Epub 2005 Aug 5. Biophys J. 2005. PMID: 16085761 Free PMC article.
-
The effect of ergosterol on dipalmitoylphosphatidylcholine bilayers: a deuterium NMR and calorimetric study.Biophys J. 2005 Mar;88(3):1799-808. doi: 10.1529/biophysj.104.051375. Epub 2004 Dec 13. Biophys J. 2005. PMID: 15596499 Free PMC article.
-
The diversity of the liquid ordered (Lo) phase of phosphatidylcholine/cholesterol membranes: a variable temperature multinuclear solid-state NMR and x-ray diffraction study.Biophys J. 2006 Apr 1;90(7):2383-93. doi: 10.1529/biophysj.104.056499. Biophys J. 2006. PMID: 16537550 Free PMC article.
-
Proton-Based Ultrafast Magic Angle Spinning Solid-State NMR Spectroscopy.Acc Chem Res. 2017 Apr 18;50(4):1105-1113. doi: 10.1021/acs.accounts.7b00082. Epub 2017 Mar 29. Acc Chem Res. 2017. PMID: 28353338 Free PMC article. Review.
-
Recent progress in dipolar recoupling techniques under fast MAS in solid-state NMR spectroscopy.Solid State Nucl Magn Reson. 2021 Apr;112:101711. doi: 10.1016/j.ssnmr.2020.101711. Epub 2021 Jan 11. Solid State Nucl Magn Reson. 2021. PMID: 33508579 Review.
Cited by
-
Phase Behavior of Binary Mixtures of SOPC and Cholesterol.ACS Omega. 2025 May 6;10(19):19235-19242. doi: 10.1021/acsomega.5c01375. eCollection 2025 May 20. ACS Omega. 2025. PMID: 40415835 Free PMC article. Review.
-
Phase studies of model biomembranes: complex behavior of DSPC/DOPC/cholesterol.Biochim Biophys Acta. 2007 Nov;1768(11):2764-76. doi: 10.1016/j.bbamem.2007.07.008. Epub 2007 Jul 25. Biochim Biophys Acta. 2007. PMID: 17825247 Free PMC article.
-
Ceramide signaling in cancer and stem cells.Future Lipidol. 2008 Jun;3(3):273-300. doi: 10.2217/17460875.3.3.273. Future Lipidol. 2008. PMID: 19050750 Free PMC article.
-
Liquid-liquid domains in bilayers detected by wide angle X-ray scattering.Biophys J. 2008 Jul;95(2):682-90. doi: 10.1529/biophysj.107.127910. Epub 2008 Apr 4. Biophys J. 2008. PMID: 18390623 Free PMC article.
-
Cholesterol-induced suppression of membrane elastic fluctuations at the atomistic level.Chem Phys Lipids. 2016 Sep;199:39-51. doi: 10.1016/j.chemphyslip.2016.05.001. Epub 2016 May 3. Chem Phys Lipids. 2016. PMID: 27154600 Free PMC article. Review.
References
-
- Simons, K., and E. Ikonen. 1997. Functional rafts in cell membranes. Nature. 387:569–572. - PubMed
-
- Ipsen, J. H., G. Karlström, O. G. Mouritsen, H. Wennerström, and M. J. Zuckermann. 1987. Phase equilibria in the phosphatidylcholine-cholesterol system. Biochim. Biophys. Acta. 905:162–172. - PubMed
-
- Vist, M. R., and J. H. Davis. 1990. Phase equilibria of cholesterol/dipalmitoylphosphatidylcholine mixtures: 2H nuclear magnetic resonance and differential scanning calorimetry. Biochemistry. 29:451–464. - PubMed
MeSH terms
Substances
LinkOut - more resources
Full Text Sources
Medical
Research Materials
