. 2006 Feb;18(2):412-21.
doi: 10.1105/tpc.105.038943. Epub 2005 Dec 30.

Regulation of phosphate homeostasis by MicroRNA in Arabidopsis

Affiliations
Free PMC article

Regulation of phosphate homeostasis by MicroRNA in Arabidopsis

Tzyy-Jen Chiou et al. Plant Cell. 2006 Feb.
Free PMC article

Abstract

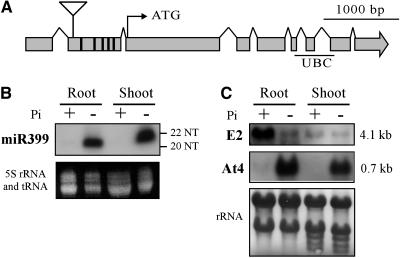
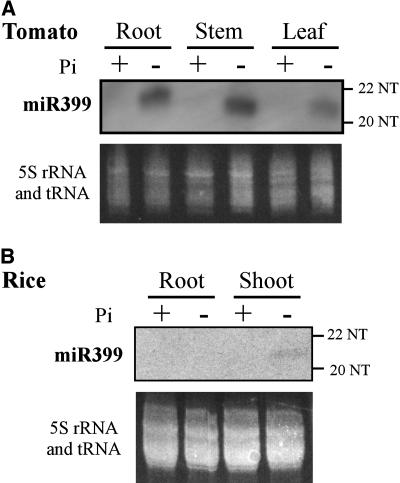
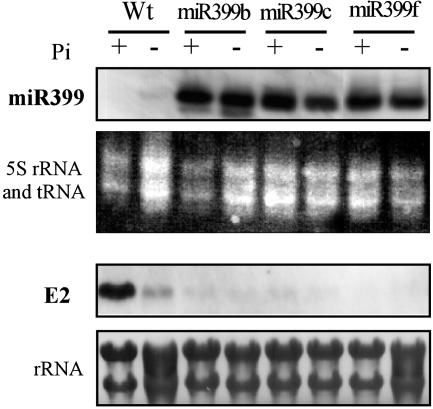
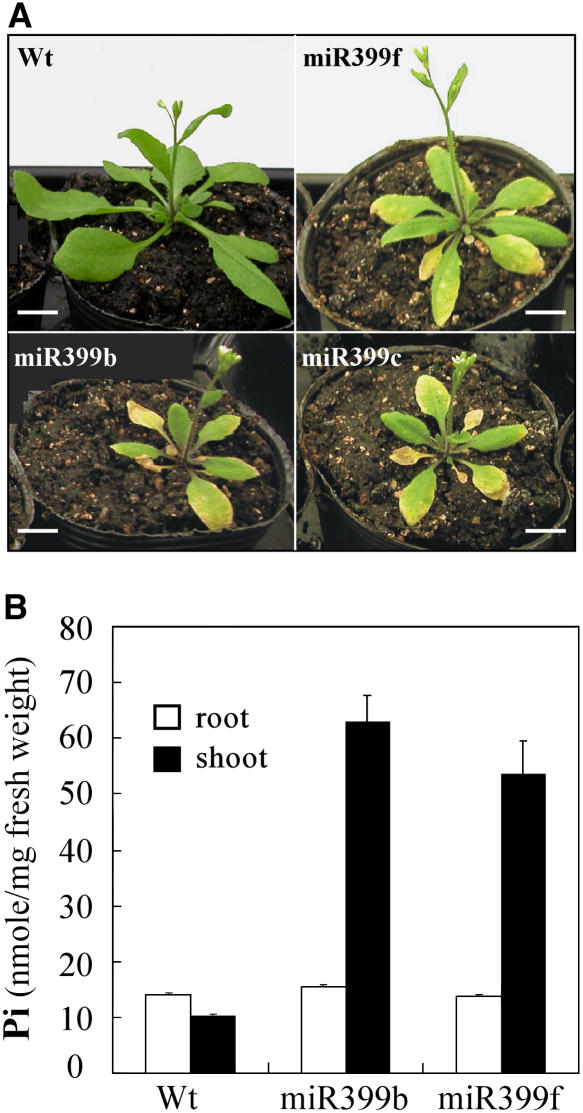
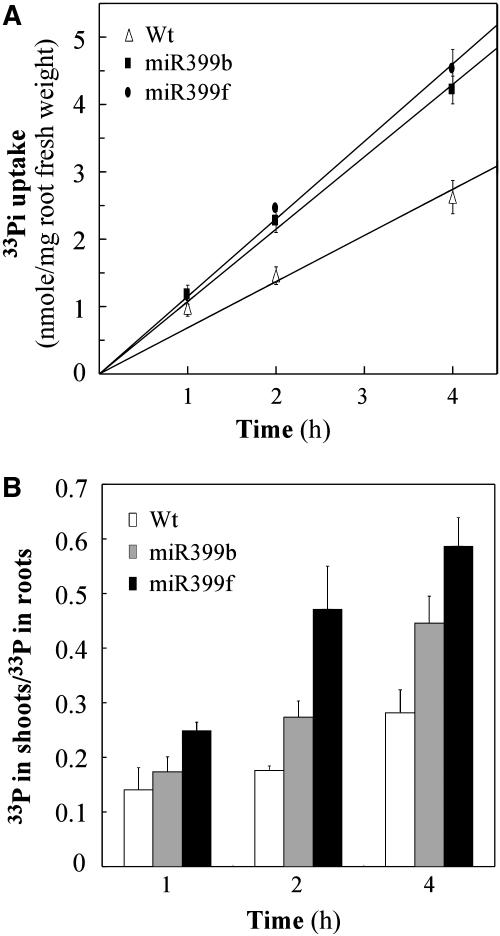
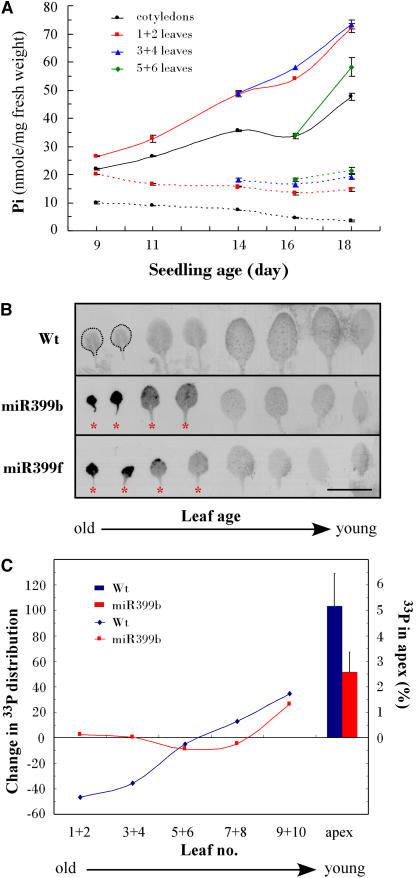
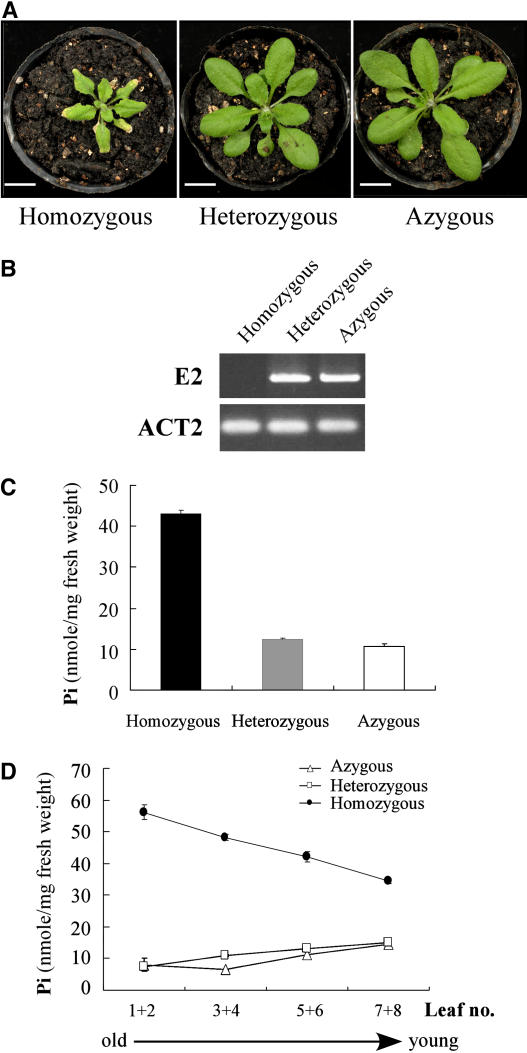
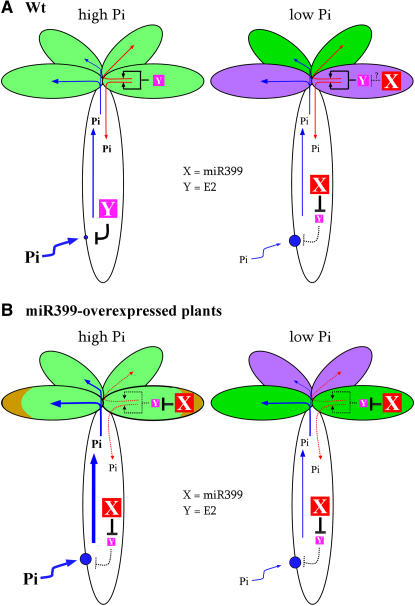
In this study, we reveal a mechanism by which plants regulate inorganic phosphate (Pi) homeostasis to adapt to environmental changes in Pi availability. This mechanism involves the suppression of a ubiquitin-conjugating E2 enzyme by a specific microRNA, miR399. Upon Pi starvation, the miR399 is upregulated and its target gene, a ubiquitin-conjugating E2 enzyme, is downregulated in Arabidopsis thaliana. Accumulation of the E2 transcript is suppressed in transgenic Arabidopsis overexpressing miR399. Transgenic plants accumulated five to six times the normal Pi level in shoots and displayed Pi toxicity symptoms that were phenocopied by a loss-of-function E2 mutant. Pi toxicity was caused by increased Pi uptake and by translocation of Pi from roots to shoots and retention of Pi in the shoots. Moreover, unlike wild-type plants, in which Pi in old leaves was readily retranslocated to other developing young tissues, remobilization of Pi in miR399-overexpressing plants was impaired. These results provide evidence that miRNA controls Pi homeostasis by regulating the expression of a component of the proteolysis machinery in plants.


Figures

Figure 1.
Figure 1.
Gene Organization and Expression of At2g33770 Encoding a Ubiquitin-Conjugating E2 Enzyme. (A) Exons and five putative miR399 target sites within the second exon are shown as gray boxes and black bars, respectively. The translation initiation site and the ubiquitin-conjugating conserved domain (UBC) are indicated. The triangle indicates the T-DNA insertion site in the SAIL_47_E01 line. (B) and (C) RNA gel blot analyses of miR399 (B) and E2 (C) transcripts in seedlings grown in high-Pi (+Pi) or low-Pi (−Pi) medium. At4, a Pi starvation–induced gene (Burleigh and Harrison, 1999), was used as a positive control. 5S rRNA and tRNA and 25S and 18S rRNA staining are shown as loading controls. NT, nucleotides.
Figure 2.
Figure 2.
RNA Gel Blot Analyses of miR399 Homologs Grown under High-Pi (+Pi) or Low-Pi (−Pi) Conditions. Homologs in tomato (A) and rice (B) were analyzed. 5S rRNA and tRNA staining is shown as the loading control. NT, nucleotides.
Figure 3.
Figure 3.
RNA Gel Blot Analyses of miR399 and E2 in Wild-Type and miR399-Overexpressing Plants (miR399b, miR399c, and miR399f). RNA was isolated from liquid-cultured root samples grown in high-Pi (+Pi) or low-Pi (−Pi) medium. 5S rRNA and tRNA and 25S and 18S rRNA staining are shown as loading controls.
Figure 4.
Figure 4.
Pi Toxicity in miR399-Overexpressing Transgenic Plants. (A) Chlorosis and necrosis in the leaf margins of miR399-overexpressing plants. Bars = 1 cm. (B) Pi concentration in roots (white bars) and shoots (black bars) of wild-type or miR399-overexpressing plants grown hydroponically under high-Pi conditions. Error bars indicate sd (n = 3).
Figure 5.
Figure 5.
Increased Pi Uptake in miR399-Overexpressing Transgenic Plants. (A) Pi uptake activities of wild-type plants (open triangles) and miR399-overexpressing plants (miR399b, closed squares; miR399f, closed circles). Error bars represent sd (n = 3). (B) Shoot-to-root ratios of the 33P taken up by wild-type plants (white bars) and miR399-overexpressing plants (miR399b, gray bars; miR399f, black bars) from (A).
Figure 6.
Figure 6.
Remobilization of Pi within Leaves. (A) Changes in Pi concentration in the leaves of wild-type plants (dotted lines) or miR399f-overexpressing plants (solid lines). Individual leaves were collected at the indicated times beginning with 9-d-old seedlings. Leaves from 10 plants were pooled, and two proximal leaves were collected as one sample for the Pi assay (cotyledons, black circles; first and second leaves, red squares; third and fourth leaves, blue triangles; fifth and sixth leaves, green diamonds). Error bars represent sd (n = 3). (B) Autoradiograms of leaf images obtained from pulse-chase labeling experiments. The first two leaves of wild-type plants are outlined because of faint signals. Leaves with the chlorosis or necrosis phenotype are marked with red asterisks. Bar = 1 cm. (C) Change in 33P distribution in the leaves of wild-type plants (blue line) and miR399b-overexpressing plants (red line) by pulse-chase labeling. Also indicated is the amount of 33P accumulated in the apex as a proportion of that in whole shoots (wild type, blue bar; miR399b, red bar). Error bars represent sd (n = 3).
Figure 7.
Figure 7.
Phenotypes of the At2g33770 (E2) T-DNA Insertion Line. (A) Chlorosis or necrosis was observed on the leaf margins of homozygous lines but not in the heterozygous or azygous lines. Bars = 1 cm. (B) RT-PCR analysis confirmed the lack of expression of E2 in the homozygous T-DNA knockout line. (C) and (D) The leaves of homozygous lines (black bar) accumulated more Pi than those of heterozygous (gray bar) or azygous (white bar) lines (C) and were also defective in the remobilization of Pi within leaves (azygous lines, open triangles; heterozygous lines, open squares; homozygous lines, closed circles) (D). Error bars represent sd (n = 3). Plants were all grown under high-Pi conditions.
Figure 8.
Figure 8.
Working Hypothesis for the Regulation of Pi Homeostasis by miR399 and E2 in Wild-Type and miR399-Overexpressing Plants. (A) Wild-type plants. (B) miR399-overexpressing plants. The solid blue circles indicate the Pi uptake system in roots. The blue and red lines indicate the translocation of Pi from roots to shoots and the remobilization of Pi out of old leaves, respectively. The dotted lines in (B) indicate the impaired Pi remobilization in miR399-overexpressing plants. Greater Pi uptake and transport activities are presented as large circles and thick lines. Purple leaves are the initiation sites of Pi starvation symptoms because of accumulated anthocyanin. Pi toxicity is shown as chlorosis in leaf margins (yellow in [B]). miR399 and E2 are X and Y, respectively. See text for a detailed description.

References

    1. Adai, A., Johnson, C., Mlotshwa, S., Archer-Evans, S., Manocha, V., Vance, V., and Sundaresan, V. (2005). Computational prediction of miRNAs in Arabidopsis thaliana. Genome Res. 15 78–91. - PMC - PubMed
    1. Allen, E., Xie, Z., Gustafson, A.M., and Carrington, J.C. (2005). MicroRNA-directed phasing during trans-acting siRNA biogenesis in plants. Cell 121 207–221. - PubMed
    1. Ames, B.N. (1966). Assay of inorganic phosphate, total phosphate and phosphatases. Methods Enzymol. 8 115–118.
    1. Axtell, M.J., and Bartel, D.P. (2005). Antiquity of microRNAs and their targets in land plants. Plant Cell 17 1658–1673. - PMC - PubMed
    1. Bachmair, A., Novatchkova, M., Potuschak, T., and Eisenhaber, F. (2001). Ubiquitylation in plants: A post-genomic look at a post-translational modification. Trends Plant Sci. 6 463–470. - PubMed

Publication types

MeSH terms

Associated data