. 2006 Jan 10;103(2):395-400.
doi: 10.1073/pnas.0509969103. Epub 2005 Dec 30.

PKA-mediated phosphorylation regulates the function of activation-induced deaminase (AID) in B cells

Affiliations

PKA-mediated phosphorylation regulates the function of activation-induced deaminase (AID) in B cells

Laura Pasqualucci et al. Proc Natl Acad Sci U S A. .

Abstract

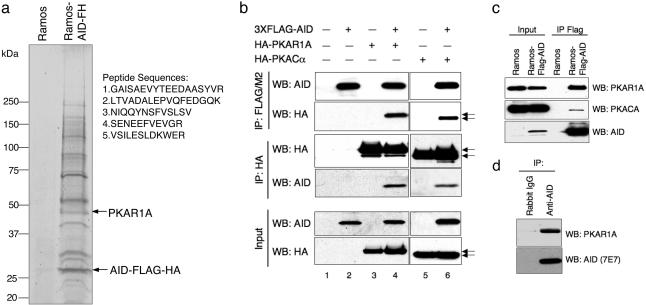
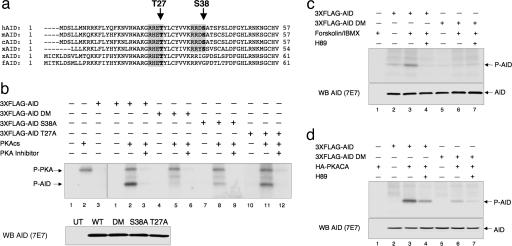
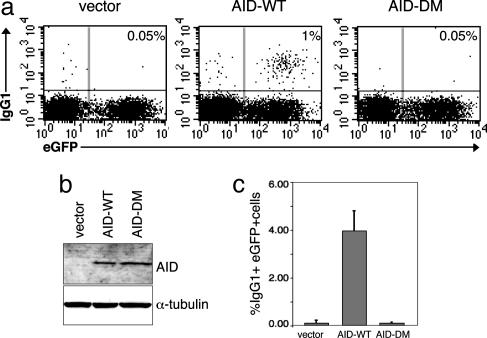
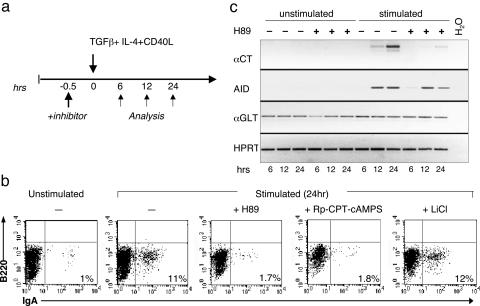
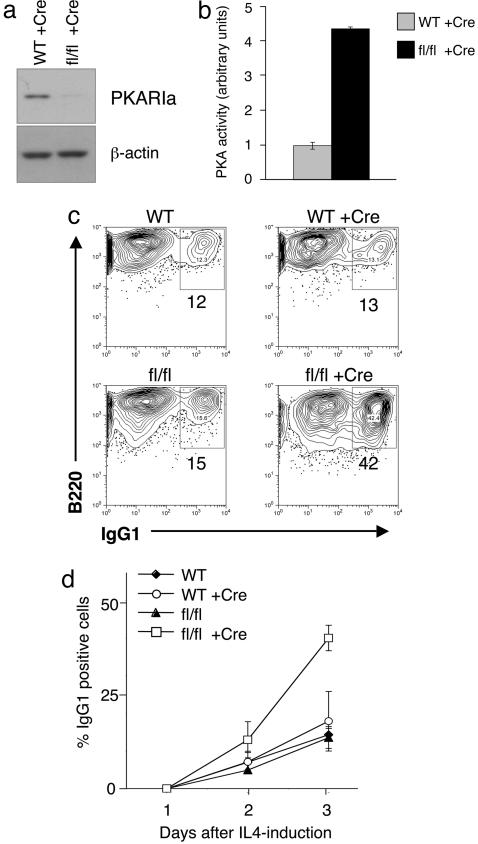
During humoral immune responses, two distinct genetic modification events diversify the Ig genes in germinal center (GC) B cells: somatic hypermutation and class switch recombination (CSR). Both processes require the activity of activation-induced cytidine deaminase (AID), an enzyme expressed specifically in GC B cells. However, the mechanisms that regulate AID activity are largely unknown. Here we report that protein kinase A (PKA) phosphorylates AID and regulates its activity in GC B cells. AID physically interacts with the PKA holoenzyme in the cytoplasm and is phosphorylated by the PKA catalytic subunit at specific residues. AID phosphorylation is required for CSR, because substitution of the two phosphorylation targets impairs its ability to rescue CSR in AID-deficient B cells. Pharmacologic inhibition of PKA prevents isotype class switching in a murine B-cell lymphoma cell line; conversely, B cells from mice where PKA activity is made constitutive by conditional deletion of the PKA regulatory subunit gene display enhanced CSR. These findings implicate PKA in the regulation of AID function and suggest that the control of T cell-dependent immune responses may be modulated, via AID, by signals that activate PKA.


Figures

Fig. 1.
Fig. 1.
Identification of PKAR1A as a cytoplasmic AID-interacting protein in vivo. (a) Colloidal blue staining of affinity-purified AID-FH complexes from cytoplasmic extracts of Ramos-AID-FH and control Ramos cells transduced with pBABEpuro retroviral vectors. Specific AID-associated bands were sequenced by mass spectrometry, and the PKAR1A peptide sequences are indicated. (b) Immunoblot analysis of AID and HA expression in FLAG/M2 (Top) and HA (Center) precipitates from 293T cells untransfected (lane 1) or transfected with vectors expressing 3XFLAG-AID, HA-PKAR1A, and HA-PKACA. In the experiments from lanes 2, 3, and 5, control empty vectors containing the 3XFLAG or HA tags only were present to monitor for nonspecific binding between the two tags. Total inputs before immunoprecipitation (30 μg) are shown at Bottom. Each set of arrows point to the PKAR1A (upper) and PKACA (lower) polypeptides. (c) In vivo interaction between endogenous PKA and AID in B cells. Cytoplasmic extracts from stable Ramos-FLAG-AID cells were immunoprecipitated by using FLAG/M2 antibodies, followed by peptide elution, and analyzed with PKAR1A, PKACA, and AID antibodies. Input corresponds to 2% of the lysate used for immunoprecipitation. (d) Physical interaction between AID and PKAR1A in the B cell line VAL. Cytoplasmic extracts were immunoprecipitated by using rabbit polyclonal anti-AID antibodies or control rabbit IgG and analyzed by Western blot with anti-AID (7E7) and anti-PKAR1α mouse monoclonal antibodies.
Fig. 2.
Fig. 2.
AID is phosphorylated by PKA in vitro and in vivo at S38 and T27. (a) Conservation of AID peptide sequences (AA 1-57) from human (h), mouse (m), chicken (c), Xenopus (x), zebrafish (z), and Japanese puffer fish (f). Shaded amino acids correspond to the consensus PKA phosphorylation motifs; the T27 and S38 residues are in bold. (b Upper Right) Semipurified 3XFLAG-AID or its derivatives were incubated with recombinant PKA catalytic subunit (cs) and [γ-32P]ATP. Eluates from untransfected 293T cells precipitated with FLAG antibodies were used as control (Left, lane 1). The reactions were loaded on SDS/PAGE and analyzed by autoradiography. Data shown are representative of three independent experiments. P-AID, phosphorylated AID. The recombinant PKA subunit, which is known to autophosphorylate itself, can also be detected in samples where the enzyme was added (P-PKA). The nature of the additional faint band between P-AID and P-PKA is unclear, because it was observed only when high amounts of immunoprecipitate were used as substrate in the assay and was not visible by Coomassie. Immunoblot analysis with anti-AID antibodies documents that equivalent amounts of substrate were used in the assay (Lower). (c Upper) Forskolin treatment selectively induces phosphorylation of AID in vivo. FLAG precipitates were prepared from total cell extracts of 32P-labeled 293T cells transfected with the indicated vectors and treated with forskolin/3-isobutyl-1-methylxantine (IBMX) for 1 h before harvesting. The PKA inhibitor H89 was added together with 32P-orthophosphate at time 0 (i.e., 40 h after transfection). The apparent residual phosphate labeling in the AID-DM transfectants may reflect the presence of additional, minor, PKA-independent phosphorylation sites or background from the immunoprecipitation reaction. Immunoblot analysis with anti-AID antibodies on the same eluates is shown in Lower.(d Upper) PKA phosphorylates AID in vivo. Autoradiography of FLAG precipitates prepared from 32P-labeled 293T cells cotransfected with plasmids expressing HA-PKACA and 3XFLAG-AID (WT or DM), in the presence or absence of H89, added 30 min beforeγ-32P. (d Lower) Immunoblot analysis with anti-AID antibodies controls for equal loading.
Fig. 3.
Fig. 3.
Mutation of the phosphorylation sites abrogates AID activity on CSR. (a) Representative flow-cytometric profiles of AID-/- murine B cells, stimulated with LPS plus IL-4 and transduced with the indicated vectors. Cells were stained with anti-IgG1-APC, and numbers indicate the percentage of cells switched to IgG1 in the total population (upper right quadrant). The results of three independent experiments (mean IgG1+ eGFP+ cells ± standard deviation) are summarized in c. Note that although considerably lower than that reported in previous studies (most likely due to the vector used), the reconstitution efficiency was still 20-fold above background and, therefore, sufficient to demonstrate the difference in the activity of the AID mutant. (b) Immunoblot analysis of AID expression in whole-cell extracts from the AID-/- B cells shown in a. α-tubulin was used as control for loading.
Fig. 4.
Fig. 4.
Pharmacologic inhibition of PKA impairs CSR in B cells. (a) Treatment schedule for induction of CSR in CH12F3 cells. (b) FACS analysis of CH12F3 cells unstimulated (Left) or stimulated for 24 h with TGFβ, IL-4 and CD40L (remaining four graphs), in the absence or presence of two PKA specific inhibitors (H89 and Rp-8-CPT-cAMPS) (Middle and Middle Right) and the GSK3 kinase inhibitor LiCl (Right). The percentage of B220+IgA+ cells (gated on live cells) is indicated. Data are representative of several independent experiments. (c) Expression of Iα-Cμ circle transcripts (αCT), AID, and αGLT in CH12F3 cells treated for 6, 12, and 24 h as indicated in the scheme. Hypoxanthine phosphoribosyltransferase (HPRT) transcripts were amplified as an internal control. Data are representative of three independent experiments that gave analogous results.
Fig. 5.
Fig. 5.
Enhanced CSR in conditional RIalphafl/fl mice. (a) Immunoblot analysis of PKAR1A expression in whole-cell extracts from purified splenic B cells of RIalphafl/fl and WT littermates 48 h after TAT-Cre transduction. Actin, loading control. (b) PKA kinase activity in the extracts from a measured by an in vitro assay and normalized to protein levels; the activity of WT B cells was arbitrarily set as 1. (c) FACS analysis of purified B cells from WT and R1alphafl/fl mice, untransduced or transduced with TAT-Cre and stimulated by LPS+IL-4. Numbers indicate the percentage of surface IgG1+ B220+ cells. One representative experiment of three giving comparable results is shown. (d) Time-dependent increase in IgG1+ cells after IL-4 treatment. Values represent the mean from three independent experiments, and error bars represent the standard deviation from the mean.

References

    1. Rajewsky, K. (1996) Nature 381, 751-758. - PubMed
    1. Papavasiliou, F. N. & Schatz, D. G. (2002) Cell 109, Suppl., S35-S44. - PubMed
    1. Manis, J. P., Tian, M. & Alt, F. W. (2002) Trends Immunol. 23, 31-39. - PubMed
    1. Honjo, T., Kinoshita, K. & Muramatsu, M. (2002) Annu. Rev. Immunol. 20, 165-196. - PubMed
    1. Revy, P., Muto, T., Levy, Y., Geissmann, F., Plebani, A., Sanal, O., Catalan, N., Forveille, M., Dufourcq-Labelouse, R., Gennery, A., et al. (2000) Cell 102, 565-575. - PubMed

Publication types

MeSH terms

Substances