. 2005 Dec;1(7):e79.
doi: 10.1371/journal.pcbi.0010079. Epub 2005 Dec 30.

New maximum likelihood estimators for eukaryotic intron evolution

Affiliations

New maximum likelihood estimators for eukaryotic intron evolution

Hung D Nguyen et al. PLoS Comput Biol. 2005 Dec.

Erratum in

  • PLoS Comput Biol. 2006 Mar;2(3):e28

Abstract

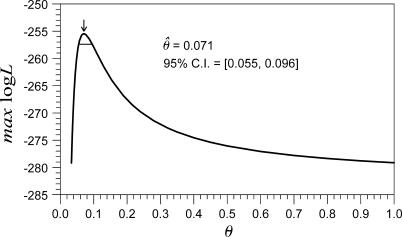
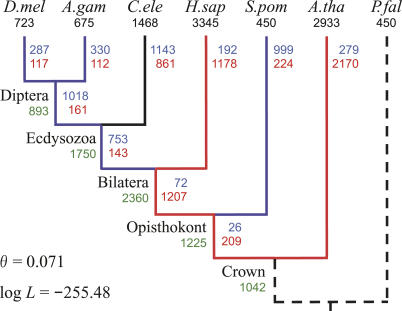
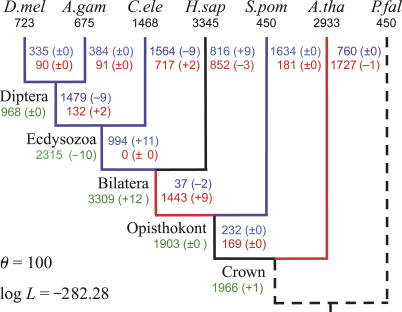
The evolution of spliceosomal introns remains poorly understood. Although many approaches have been used to infer intron evolution from the patterns of intron position conservation, the results to date have been contradictory. In this paper, we address the problem using a novel maximum likelihood method, which allows estimation of the frequency of intron insertion target sites, together with the rates of intron gain and loss. We analyzed the pattern of 10,044 introns (7,221 intron positions) in the conserved regions of 684 sets of orthologs from seven eukaryotes. We determined that there is an average of one target site per 11.86 base pairs (bp) (95% confidence interval, 9.27 to 14.39 bp). In addition, our results showed that: (i) overall intron gains are approximately 25% greater than intron losses, although specific patterns vary with time and lineage; (ii) parallel gains account for approximately 18.5% of shared intron positions; and (iii) reacquisition following loss accounts for approximately 0.5% of all intron positions. Our results should assist in resolving the long-standing problem of inferring the evolution of spliceosomal introns.


Conflict of interest statement

Competing interests. The authors have declared that no competing interests exist.

Figures

Figure 1
Figure 1. Two Hypotheses for the Relationship among Three Groups: Arthropods (A), Nematodes (N), and Deuterostomes (D)
The coelomata hypothesis is shown on the left, and the ecdysozoa hypothesis is shown on the right.
Figure 2
Figure 2. Relationship between θ and the Maximum Log-Likelihood Value
The ecdysozoa phylogeny was used. The maximum log-likelihood value was calculated by treating all parameters other than θ as nuisance parameters and maximizing over them. The arrow shows the MLE of θ as 0.071. The horizontal line indicates a 95% CI of 0.055–0.096. The maximum log-likelihood value at the MLE of θ was −255.48.
Figure 3
Figure 3. MLEs of the Number of Gains and Losses Using the Ecdysozoa Phylogeny
Numbers of introns present in modern species (known) are in black. Numbers of introns present in ancestors (estimated) are in green. Numbers of gains and losses (estimated) are in red and blue, respectively. Branches that experienced >1.5 gains per loss are shown in red, and those that experienced >1.5 losses per gain are in blue. D.mel, D. melanogaster; A.gam, A. gambiae; C.ele, C. elegans; H.sap, H. sapiens; S.pom, S. pombe; A.tha, A. thaliana; P.fal, P. falciparum.
Figure 4
Figure 4. Comparison of Results between the EM algorithm (θ = 100) and a Previous ML Method [6]
The results of the EM algorithm when using θ = 100 are shown. Numbers in parentheses indicate the differences between the two results using our results as the benchmark. Numbers of introns present in modern species (known) are in black. Numbers of introns present in ancestors (estimated) are in green. Numbers of gains and losses (estimated) for each branch are in red and blue, respectively. Branches that experienced >1.5 gains per loss are shown in red, and those that experienced >1.5 losses per gain are in blue. D.mel, D. melanogaster; A.gam, A. gambiae; C.ele, C. elegans; H.sap, H. sapiens; S.pom, S. pombe; A.tha, A. thaliana; P.fal, P. falciparum.

Comment in

  • On the estimation of intron evolution.
    Csurös M. Csurös M. PLoS Comput Biol. 2006 Jul 28;2(7):e84; author reply e83. doi: 10.1371/journal.pcbi.0020084. PLoS Comput Biol. 2006. PMID: 16863393 Free PMC article. No abstract available.

References

    1. Sambrook J. Adenovirus amazes at Cold Spring Harbor. Nature. 1977;268:101–104. - PubMed
    1. Betts MJ, Guigó R, Agarwal P, Russell RB. Exon structure conservation despite low sequence similarity: A relic of dramatic events in evolution? EMBO J. 2001;20:5354–5360. - PMC - PubMed
    1. Yoshihama M, Uechi T, Asakawa S, Kawasaki K, Kato S et al. The human ribosomal protein genes: Sequencing and comparative analysis of 73 genes. Genome Res. 2002;12:379–390. - PMC - PubMed
    1. Rogozin IB, Wolf YI, Sorokin AV, Mirkin BG, Koonin EV. Remarkable interkingdom conservation of intron positions and massive, lineage-specific intron loss and gain in eukaryotic evolution. Curr Biol. 2003;13:1512–1517. - PubMed
    1. Nielsen CB, Friedman B, Birren B, Burge CB, Galagan JE. Patterns of intron gain and loss in fungi. PLoS Biol. 2004;2:e422. DOI: . - DOI - PMC - PubMed

Publication types